Download

1 / 9
90 likes | 173 Views
Bivariate data necessities. Things you possibly missed and need to have…. Justify your variables . Which is the explanatory and response? WHY!!!?

E N D
Bivariate data necessities Things you possibly missed and need to have…
Justify your variables • Which is the explanatory and response? • WHY!!!? • You must justify your classification. E.g. weight is the response variable because we would expect the weight to increase when height increases. It is unlikely that you would get taller by gaining weight but it seems sensible to assume that the weight responds to a change in height.
Relate your variables to the purpose • When you pose your investigation and choose your variables, remember that you must have a reason to choose those variables- state the reason. • You must relate your findings to the purpose of the investigation- if you cannot directly relate your findings to the underlying purpose you probably have selected poor variables. • E.g. I am using the length of the nose and the width of the nose in an attempt to identify the relationship between these two variables. By isolating this relationship and comparing the two subspecies of dolphins individually I hope to prove that there are significant differences between the subspecies which will justify their separate classifications as subspecies.
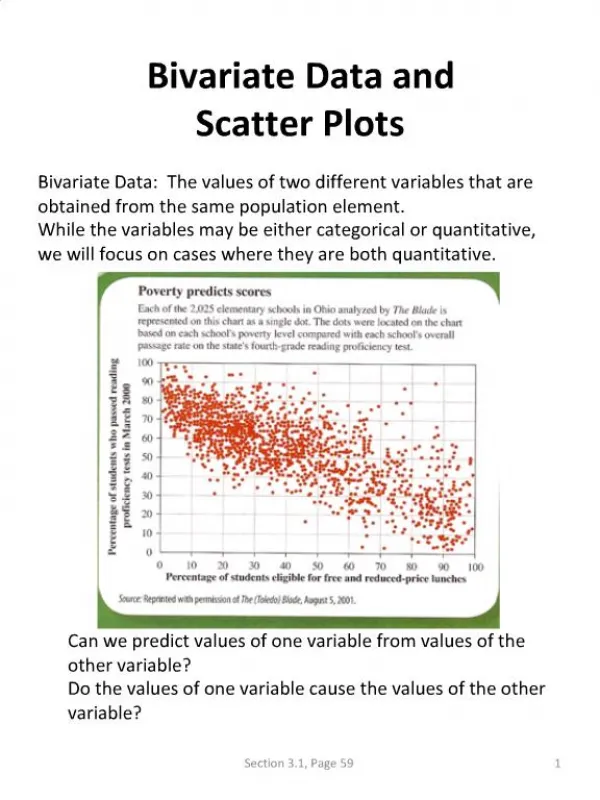
Visually assess the data • The very first and most important part of the investigation is to visually assess the data. Plot your data, fit a linear model to it; describe what you see. • DO NOT REFERENCE NUMBERS. • Consider: Trend- Linear? Positive? Negative? Strength? Scatter? Other features- Outliers? Groupings? • This must be done first- reference correlation numbers as backup (r and R^2).
What is the nature of the relationship? • You must state how the variables relate to each other IN CONTEXT!!! • You should ALWAYS include a statement like: • As a persons height increases, so to does their weight. • In general, the taller a person is, the heavier they are. • As a person grows in height they tend to get heavier. • You should state that there is no relationship if there is no relationship between the two variables.
Make predictions • Use your linear model to make a prediction. • To be safe, always choose an x value within your dataset and choose an x value outside your dataset. • COMMENT ON RELIABILITY OF PREDICTIONS!!! • E.g. Based on my model of y=mx+c I think a 150cm tall person would be approximately 70kgs. This is close to the actual data of 72kgs for a 151cm person. I also predicted that a 80cm tall person would be 15kgs. This seems very unrealistic because an 80cm tall child would die if they were that light. For this reason I think that my model is only reliable for people with heights between 140 and 200 cm in height.
Investigate other models • Use residuals to check for random scatter about your linear model- it is better to make prediction for every x-value in your dataset to check reliability in your model. • If it does not appear random- try other models such as exponential, power etc etc. • If these appear to fit the data better then you should comment on WHY- you can’t just use it, you must justify.
Answer your investigation- Conclusion! • You MUST CONCLUDE YOUR INVESTIGATION!!!! • A conclusion is a short summary of your findings paired with a concise answer to your investigations purpose and any underlying questions set out to answer. • E.g. The graph of the raw data suggested to us that there is a strong positive linear correlation between height a weight. Based on this we can deduce that as a persons height increases, so does their weight. By splitting the data into male and female sections we noticed that there is a difference between the two genders. Females weight appears to be less influenced by height than males. We also noted that most females tend to be shorter than males.
Always remember • Throughout the entire investigation you need to justify all of your decisions. • Most options can be counted as correct IF they are justified with reasonable reasons. • In order to access higher grades you must demonstrate higher levels of understanding by explaining the findings and attempting to justify these in context. • You will do better if you can describe what you see than interpret numbers in these investigations.