Download
1 / 6
60 likes | 201 Views
Bivariate Data Pt. 2. September 2011. When good statistics go bad…. Correlation is not the same thing as association. Association is a much more general term. Correlation specifically describes the strength of a linear relationship between two variables.

E N D
Bivariate Data Pt. 2 September 2011
When good statistics go bad… • Correlation is not the same thing as association. Association is a much more general term. Correlation specifically describes the strength of a linear relationship between two variables. • Don’t correlate categorical variables: Woe unto you etc. • Watch out for outliers. They are influential on the correlation.
When good statistics go bad… • Correlation is different than causation. In order to establish causation, we have to design an experiment that would show that one variable causes an increase or decrease in a correlated variable. There will be a whole unit on how we would set this up
Does smoking cause cancer… …or does cancer cause smoking? • It has been established that smoking and lung cancer incidence are correlated. • In the absence of an experiment that would determine the causation, the claim that smoking causes cancer is not defensible. • It could be just as easily claimed that cancer causes smoking. • What are some hot-button topics that you can think of where a correlation might be conflated with causation?
Who’s that hiding in the corner? It’s a variable. A lurking variable. • A homeowners insurance company noticed that there were a lot of burglary and vandalism claims in a particular community. They also noticed that a lot of the homes in that community had security systems. What conclusion can be made? • Obvious: Security system ownership is correlated with insurance claims. • What’s our possible lurker? Often, a lurking variable can explain both variables that you’re analyzing.
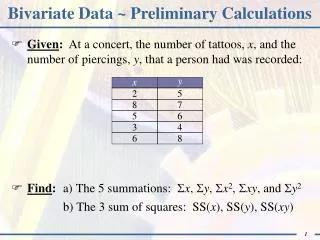
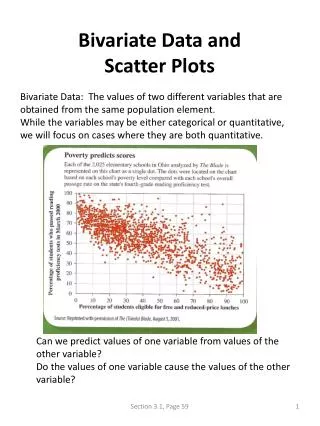
Examination of Problem 18 • Read question 18 on page 164 and create the scatterplot (a).