Download
1 / 1
20 likes | 233 Views
Drinking Water Mapping Application Source Water Protection Tools. Roger Anzzolin (EPA OGWDW), William Cooter, Jay Rineer & Brandon Bergenroth (RTI International). Overview

E N D
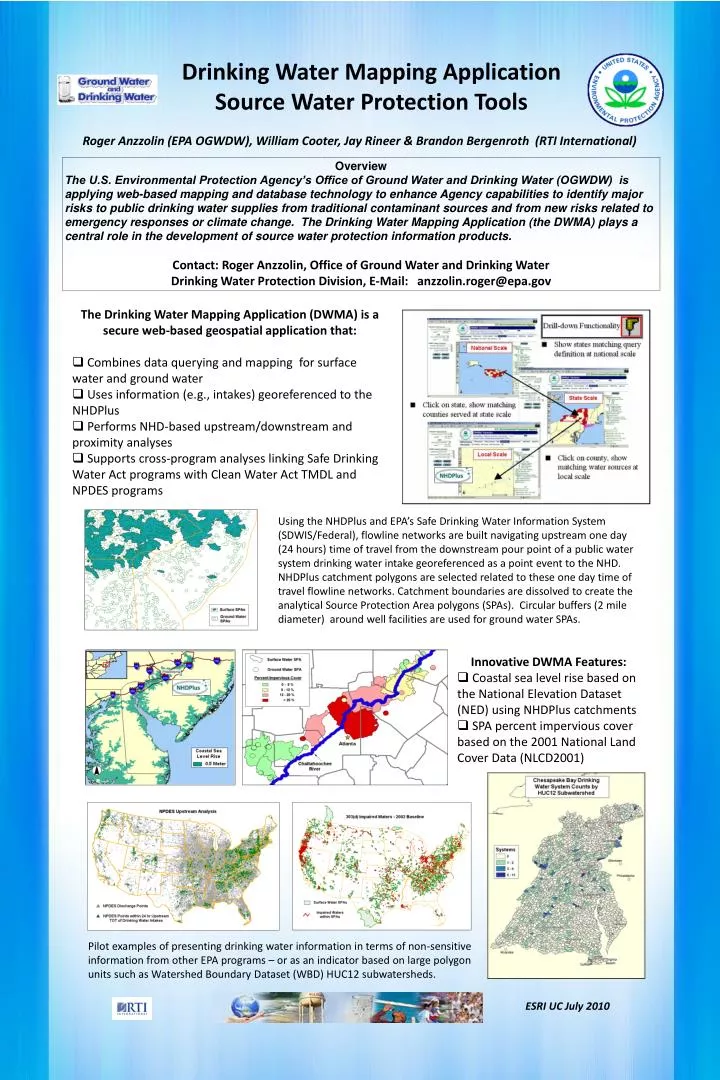
Drinking Water Mapping Application Source Water Protection Tools Roger Anzzolin (EPA OGWDW), William Cooter, Jay Rineer & Brandon Bergenroth (RTI International) Overview The U.S. Environmental Protection Agency’s Office of Ground Water and Drinking Water (OGWDW) is applying web-based mapping and database technology to enhance Agency capabilities to identify major risks to public drinking water supplies from traditional contaminant sources and from new risks related to emergency responses or climate change. The Drinking Water Mapping Application (the DWMA) plays a central role in the development of source water protection information products. Contact: Roger Anzzolin, Office of Ground Water and Drinking Water Drinking Water Protection Division, E-Mail: anzzolin.roger@epa.gov • The Drinking Water Mapping Application (DWMA) is a secure web-based geospatial application that: • Combines data querying and mapping for surface water and ground water • Uses information (e.g., intakes) georeferenced to the NHDPlus • Performs NHD-based upstream/downstream and proximity analyses • Supports cross-program analyses linking Safe Drinking Water Act programs with Clean Water Act TMDL and NPDES programs Using the NHDPlus and EPA’s Safe Drinking Water Information System (SDWIS/Federal), flowline networks are built navigating upstream one day (24 hours) time of travel from the downstream pour point of a public water system drinking water intake georeferenced as a point event to the NHD. NHDPlus catchment polygons are selected related to these one day time of travel flowline networks. Catchment boundaries are dissolved to create the analytical Source Protection Area polygons (SPAs). Circular buffers (2 mile diameter) around well facilities are used for ground water SPAs. • Innovative DWMA Features: • Coastal sea level rise based on the National Elevation Dataset (NED) using NHDPlus catchments • SPA percent impervious cover based on the 2001 National Land Cover Data (NLCD2001) Pilot examples of presenting drinking water information in terms of non-sensitive information from other EPA programs – or as an indicator based on large polygon units such as Watershed Boundary Dataset (WBD) HUC12 subwatersheds. ESRI UC July 2010