Download
1 / 26
260 likes | 373 Views
SMEI direct observations and 3D-reconstruction measurements and their comparison with STEREO instrumentation. B.V. Jackson, M.M. Bisi, P.P. Hick, A. Buffington, J.M. Clover Center for Astrophysics and Space Sciences, University of California at San Diego, LaJolla, CA, USA and

E N D
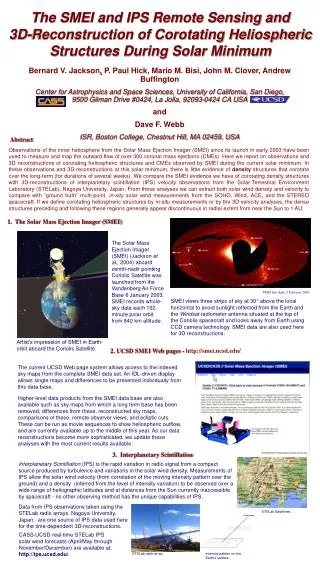
SMEI direct observations and 3D-reconstruction measurements and their comparison with STEREO instrumentation B.V. Jackson, M.M. Bisi,P.P. Hick, A. Buffington, J.M. Clover Center for Astrophysics and Space Sciences, University of California at San Diego, LaJolla, CA, USA and D.F. Webb Institute for Space Research, Boston College, Chestnut Hill, MA
Heliospheric C.A.T. Analyses The outward-flowing solar wind structure follows very specific physics as it moves outward from the Sun Thomson scattering
27-28 May 2003 CME events brightness time series for select sky sidereal locations SMEI Brightness with a long-term (~30 day) base removed. (1 S10 = 0.46 ± 0.02 ADU)
2003 May 27-28 CME events SMEI density 3D reconstruction of the 28 May 2003 halo CME as viewed from 5º above the ecliptic plane about 90º West of the Sun-Earth line. SMEI density 3D reconstruction of the 28 May 2003 halo CME as viewed from 15º above the ecliptic plane about 30º East of the Sun-Earth line. SMEI density (remote observer view) of the 28 May 2003 halo CME
2003 May 27-28 CME events CME masses
27-28 May 2003 CME events mapped to in-situ Wind spacecraft measurements (CR 2003) SMEI proton density 3D reconstruction of the 28 May 2003 halo CME compared with Wind
Mass determination ~6.7 1016g excess and 8.3 1016g total for northward directed structure within the 10 e-cm-3 contour. SMEI 3D recon-struction of the October 28 CME. The above structure has a mass of about 0.5 1016g excess in the sky plane but ~ 2.0 1016g excess at 60º (Vourlidas, private communication, 2004). SMEI C.A.T. Analysis
2003 October 28 CME Northeast-directed ejecta is more-nearly earth-directed Southward ejecta C2 image LASCO C2 CME image to 6 Rs. Southward ejecta SMEI enhanced Sky Map image and animation to 110º elongation. SMEI C.A.T. Analysis
2003 October 28 CME By the way! 2003/10/30 00 UT ^ | 1 AU “B” fit of the 28 October 2003 CME Magnetic loop analysis by T. Mulligan SMEI Sky Map image to 110º LASCO C2 CME image to 6 Rs.
Recent higher-resolution SMEI PC 3D reconstructions show the CME sheath region as well as the central dense core 2003 October 28 CME higher-resolution analysis shock Ecliptic cut Meridional cut SMEI C.A.T. Analysis
20 November 2007 CME higher- resolution analysis Ecliptic cut Fisheye SMEI C.A.T. Analysis
20 November 2007 CME in situ analysis STEREO B Wind STEREO A
20 November 2007 CME higher- resolution analysis In-situ example 3D reconstruction at STEREO A SMEI-derived Ecliptic cut SMEI C.A.T. Analysis
Comparison views of SMEI 3D reconstruction and STEREO HI-2A view STEREO A image with a combined image average subtracted SMEI - STEREO A ecliptic cut coverage SMEI 3D reconstruction of the STEREO A view SMEI C.A.T. Analysis
SMEI View From STEREO HI 2’s 20 November 2007 SMEI analysis STEREO A view STEREO B view SMEI C.A.T. Analysis
SMEI and STEREO HI 2 Comparison 24-25 January 2007 CME analysis STEREO A HI-2 SMEI “Study of CME Propagation in the Inner Heliosphere: SMEI and STEREO HI Observations of the January 2007 Events”, D. F. Webb1, T. A. Howard, C. D. Fry, T. A. Kuchar1, D. Odstrcil, B. V. Jackson, M. M. Bisi, R. A. Harrison, J. S. Morrill, R. A. Howard, and J. C. Johnston (Solar Phys. submitted)
SMEI and STEREO HI 2 Comparison 24-25 January 2007 CME analysis “Study of CME Propagation in the Inner Heliosphere: SMEI and STEREO HI Observations of the January 2007 Events”, D. F. Webb1, T. A. Howard, C. D. Fry, T. A. Kuchar1, D. Odstrcil, B. V. Jackson, M. M. Bisi, R. A. Harrison, J. S. Morrill, R. A. Howard, and J. C. Johnston (Solar Phys. submitted)
SMEI and STEREO HI 2 Comparison 24-25 January 2007 CME analysis “Study of CME Propagation in the Inner Heliosphere: SMEI and STEREO HI Observations of the January 2007 Events”, D. F. Webb1, T. A. Howard, C. D. Fry, T. A. Kuchar1, D. Odstrcil, B. V. Jackson, M. M. Bisi, R. A. Harrison, J. S. Morrill, R. A. Howard, and J. C. Johnston (Solar Phys. submitted)
SMEI and STEREO HI 2 Comparison 24-25 January 2007 CME analysis CASS/UCSD SECCHI OCT 2008
SMEI and STEREO HI 2 Comparison 24-25 January 2007 CME analysis CASS/UCSD SECCHI OCT 2008
SMEI and STEREO HI 2 Comparison 24-25 January 2007 CME analysis
SMEI and STEREO HI 2 Comparison 24-25 January 2007 CME analysis CASS/UCSD SECCHI OCT 2008
SMEI and STEREO HI 2 Comparison WHI March-April 2008 analysis WHI “Low resolution STELab IPS 3D Reconstructions of the Whole Heliospheric Interval and Comparison with in-Ecliptic Solar Wind Measurements from STEREO and Wind Instrumentation”, M. M. Bisi, B.V. Jackson, A. Buffington, J.M. Clover, P.P. Hick, M. Tokumaru (Solar Phys. submitted)
SMEI and STEREO HI 2 Comparison WHI March-April 2008 analysis
Sample HI-2A brightness time series for select sky sidereal locations HI-2A brightness time series with a long-term (7-day minimum) base removed. HI-2A image on 01 July and time series locations Venus?
Summary and where are we going: We have now devised a wealth of “tools” to understand and analyze the SMEI image data, and to ascertain how well the SMEI 3D reconstructions work. Provided the HI-2 instruments have the stability to provide brightness above a long-term base (we think they do), we now have the tools required to view common structures and to reconstruct the regions in common between the HI-2 and SMEI. CASS/UCSD SECCHI OCT 2008