Download
1 / 13
130 likes | 272 Views
Fires and the Contemporary Global Carbon Cycle Guido van der Werf (Free University, Amsterdam, Netherlands) In collaboration with: Jim Randerson (UCI, CA, USA) Louis Giglio (SSAI, MD, USA) Prasad Kasibhatla (Duke University, NC, USA) Jim Collatz (NASA GSFC, MD, USA). Main Objectives

E N D
Fires and the Contemporary Global Carbon Cycle Guido van der Werf (Free University, Amsterdam, Netherlands) In collaboration with: Jim Randerson (UCI, CA, USA) Louis Giglio (SSAI, MD, USA) Prasad Kasibhatla (Duke University, NC, USA) Jim Collatz (NASA GSFC, MD, USA)
Main Objectives • Quantify the contemporary amount of biomass burned on a global scale • Assess the role of biomass burning in the global CO2 and CH4 cycle • Determine the climate sensitivity of biomass burning
‘Classical’ approach: Emissions = Σx,t A × B × CC × EF Giglio et al, submitted to ACPD
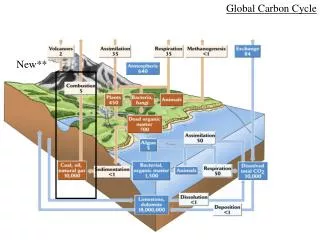
Fires embedded in the CASA satellite-driven biogeochemical model Combustion Respiration Fuelwood collection Herbivore consumption f (A,CC,M) f (A,CC) Net Primary Production Aboveground Aboveground Biomass C Litter C Allocation = f (treecover) Belowground Belowground Biomass C Litter C A = area burnt CC = combustion completeness M = fire induced mortality
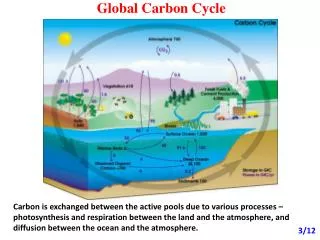
Annual fire emissions as percentage of NPP, averaged over the 1997 – 2004 period
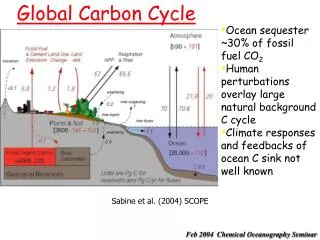
Fuel consumption as calculated by CASA Emission (g) per m2 burned
On a global scale, IAV in burned area and emissions are decoupled BA driven by savannas Emissions driven by forest fires (including deforestation) 1997 peat burning in Asia
Atmospheric CO as a constrain on fire emissions Observed CO anomalies Boreal region CO (forward modeling)
Contribution of IAV in fire activity to CO2 and CH4 growth rates • CO: forward modeling optimized in inversion to fit observations • CO2: fires explain ~2/3 of the growth rate anomaly (60% SE-Asia, 30% C+S America, 10% Boreal) • CH4: fires explain most of the growth rate anomaly.
Mismatch in seasonality between top-down and bottom-up observations (southern Africa) Atmosphere: peak in September - October Satellite surface observations: peak in June – July - August
Concluding remarks • Global (vegetation) fire emissions as calculated by our modeling framework is ~2.5 Pg C / year, largest uncertainties in deforestation regions • IAV in fire emissions contributed significantly to variability in the 1997-2001 growth rate of CO2 and CH4. • IAV in fire emissions is dominated by IAV in forest fires. Implications: • IAV in burned area and emissions are decoupled • IAV in CO and CH4 is larger than IAV in C or CO2 • (Multi-specie) inversions and high resolution (deforestation) fire modelling ideally employed to further improve estimates