Download
1 / 36
400 likes | 745 Views
Spectrophotometry Basics. Adapted from Basic Laboratory Methods for Biotechnology by Lisa Seidman and Cynthia Moore. Background. Spectrophotometry uses light waves to measure characteristics of a given sample

E N D
Spectrophotometry Basics Adapted from Basic Laboratory Methods for Biotechnology by Lisa Seidman and Cynthia Moore
Background • Spectrophotometry uses light waves to measure characteristics of a given sample • The effect the sample has on the light allows for determination of characteristics of the sample • Spectrophotometers are used in biotechnology and other laboratories for a variety of purposes
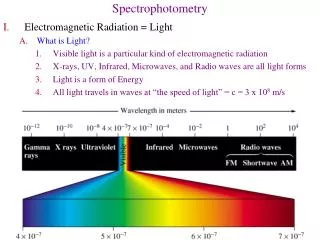
Electromagnetic Spectrum • All the types of electromagnetic radiation together make up the electromagnetic spectrum • Includes gamma rays, x-rays, ultraviolet light, visible light, infrared light, microwaves, and radio waves • Each type of radiation has a particular way of interacting with matter
Electromagnetic Spectrum • EMR travels in different ways through space • Sometimes EMR travels as waves, with crests and troughs • Wavelength is the distance from the crest of one wave to the crest of the next • Wavelength determines the amount of energy radiation has • Sometimes EMR travels as packets of energy called photons
Electromagnetic Spectrum • Visible light is the range of EMR that human eyes are able to “see”, from 400 to 800nm wavelength • Colors are perceived due to different wavelengths of light interacting with objects • The ultraviolet portion, UV, is invisible to human eyes, but can cause certain pigments to fluoresce, or glow, and is divided into three categories
UV Light • UV-A is in the 315-400nm range and is found in tanning bulbs and black lights • UV-B is in the 280-315nm range and is know to damage biological tissues and cause skin cancer, and is used in biotech labs to visualize DNA • UV-C is in the 180-280nm range and is usually not seen in nature, but is found in germicidal lamps that are used for decontamination and sterilization
Light and Matter • When light comes into contact with matter, various outcomes can occur • Light may be transmitted, and pass unchanged through the material • Light may be reflected, and change direction, as by a mirror • Light may be scattered, or deflected into many different directions • Light may be absorbed, where it transfers some or all of its energy to the material
Absorbance and Reflectance • Different wavelengths are absorbed by different materials and determine colors of objects • Wavelengths absorbed by particular objects do not return to our eyes to be seen • Objects that absorb all wavelengths appear to be black • Objects that reflect certain wavelengths appear to be the color of that wavelength • Objects that reflect all wavelengths appear to be white • White light is polychromatic, made of many wavelengths
Solutions and Light • Most spectrophotometry specimens are liquid • Liquids not only absorb light, but may transmit it as well • Spectrophotometers detect how much light is absorbed and how much is transmitted by a solution at a particular wavelength • Solutions absorb certain wavelengths and appear to be the complementary colors of those wavelengths • Absorbed wavelengths outside the visible range have no impact on color • Solutions that are colorless do not absorb visible wavelengths of light
Absorbance Spectrum • Spectrophotometers allow a graphical display of light absorption patterns • Wavelength is plotted against the absorbance, and a series of peaks are created • The extent to which a material absorbs different wavelengths is its absorbance spectrum • Individual compounds have their own characteristic absorbance spectra • Each compound has the same peaks and valleys, regardless of the amount present
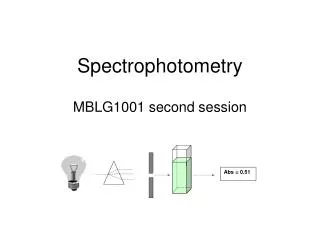
Measuring Transmittance • The analyte is the part of the sample you are trying to gather data about • It is usually dissolved in a solvent • It is placed in a cuvette (also called a cell) that holds the sample to be measured • The solvent and any other reagents that were added to the sample make up the blank, placed in an identical cuvette to the analyte • Light is applied to the sample and the spectrophotometer compares the amount of light transmitted through the sample to the amount of light transmitted through the blank • The ratio of light transmitted through the sample to the amount of light transmitted through the blank is the transmittance, t • Percent transmittance, T, is the transmittance times 100% • %T = t x 100%
Measuring Absorbance • Most analysts are more interested in the amount of light absorbed by a sample than in the transmittance • Absorbance is calculated from transmittance by the equation A= -log10(t) • Absorbance can also be calculated by the equation A = 2-log10(%T) • Absorbance is referred to as optical density, OD, and does not have units • OD values may be followed by A or AU
Relationship of Concentration and Light Transmitted • Transmittance and analyte concentration do not have a linear relationship • Absorbance and analyte concentration have a linear relationship • Absorbance values are more convenient for determination of solute concentration in a solution • Absorbance and transmittance have an inverse relationship • Most spectrophotometers can display either transmittance or absorbance values
Basic Spectrophotometer Components • Light source (bulb or lamp) produces light used to illuminate the sample • Tungsten filament lights usually used for visible light • Deuterium arc or xenon lamps used for UV light • All lamps polychromatic, have different ranges of wavelengths • Wavelength selector isolates light of a narrow range of wavelengths • Photometers use filters that block light above or below a certain wavelength, but can’t make monochromatic light • Monochromators have three main components, and can separate polychromatic light into component wavelengths and can be used to select the desired wavelength
Monochromator Components • The entrance slit shapes light entering monochromator into a parallel beam that strikes the dispersing element • A dispersing element is used to disperse light into it component wavelengths • Earlier spectrophotometers used prisms, modern instruments use diffraction gratings • Consist of a series of microscopic grooves etched onto a mirrored surface that diffract light and disperse it into component wavelengths • The exit slit allows selected light to exit the monochromator by rotating the diffraction grating so desired wavelength of light reaches the slit • Light exiting the monochromator is made of a narrow range of wavelengths centered at the chosen wavelength
The Sample Chamber • A light-tight chamber that holds the sample that is in a cuvette, or sample cell • The path length, determined by the cuvette’s interior dimension, is the distance the light travels through the sample or blank • A 1cm path length is standard for volumes of 1 to 5 ml, but may be different in small volume systems
The detector • Senses the light coming from the sample or blank and converts the information into an electrical signal • A photomultiplier tube is the most common type of detector • Contains a series of metal plates coated with a layer of photoemissive material that emits electrons when struck by photons • The stream of electrons emitted creates an electrical signal that the detector assembly processes and converts to a transmittance and/or absorbance reading • Inaccurate at very high or low transmittance levels, and more responsive to some wavelengths than others
The Display • An analog meter with a needle that moves to display the signal is the simplest • A digital display can be used to output the signal, like an LCD • Modern instruments communicate with a printer and/or a computer for display, storage, and analysis of data
Using Spectrophotometers • The blank is measured first, and used to set the instrument’s absorbance to zero or % transmittance to 100 • The sample(s) is/are only analyzed after the instrument has been “blanked” • The instrument must be blanked every time the wavelength is changed, and periodically even when the wavelength has not been changed
Blanking Compensates For • Absorption of light by sample materials other than the analyte • Absorption of light by the cuvette • Variations in emission of light as source ages • Power level fluctuations • Variation in intensity of light emission with different wavelengths • Variation in detector sensitivity to different wavelengths
Cuvettes • Glass and some plastic are transparent to visible light, but not to UV • Quartz glass transparent to visible and UV light • Some disposable plastic cuvettes can be used with smaller wavelengths • Cuvettes have clear sides for transmission of light and “frosted” sides which will block light • Cuvettes must be properly aligned in the holder for light to be transmitted • Small scratches and dirt scatter or absorb light and reduces cuvettes’ usefulness
Samples • Must be well mixed and homogenous • Air bubbles are to be avoided • Particulates should be avoided, unless turbidity is a characteristic of the sample • Solvent properties regarding light must be considered • The absorbance of too much light by solvents will interfere with sample analysis
Spectrophotometer Designs • Single beam spectrophotometers must be blanked after each wavelength change • Scanning spectrophotometers can rapidly scan through a wavelength range and construct an absorbance spectrum • Double beam scanning specs have two sample holders and oscillate the beam between sample and blank, allowing for continuous and automatic comparison • Other scanning specs use microprocessors to store data from scanning the blank at all desired wavelengths, before replacing the blank with the sample and scanning in the same manner • The microprocessor compares the absorbances and generates a spectrum • Scan speed is dependant on the instrument’s response rate • Operating at a speed that is too fast leads to a tracking error, where the absorbance peaks are shifted from their true locations
Spectrophotometer Designs • Specs that use a photodiode array detector (PDA) in place of a PMT can determine a sample’s absorbance over the entire UV/Vis range almost instantly • Each diode responds to a specific wavelength, which causes the diode’s voltage to change upon striking • In PDA instruments, the sample receives all the light from the source, and the monochromator after the sample chamber that disperses the transmitted light and sends it to the PDA • The computer compares the transmittance of the sample to the blank for every wavelength transmitted and creates the absorbance spectrum
Spectrophotometers and Microprocessors • Microprocessors control many aspects of modern specs • Wavelength scanning control, generation of absorbance spectra, storage and retrieval of information, performing calculations and statistics, and plotting data are all done by microprocessors and software
Quality Control and Performance Verification • Spec performance must be periodically checked and documented • Performance outside standards must be corrected by calibration or repair • Frequency of performance verification depends on the lab, instrument usage, and regulations or standards the lab must follow • Performance verification or repairs may be performed in house, or by service personnel if the instrument is too complex • Performance characteristics affect the accuracy, precision, and range of spec operation
Performance Characteristics • Calibration brings the readings of an instrument into range with accepted values • Determining wavelength accuracy (agreement between selected and actual) and photometric accuracy (agreement of measured value with reference value) are important in calibration • Stray light that reaches the detector without sample interaction can affect readings and should be kept to a minimum
Performance Characteristics • The relationship between light intensity striking the detector and the detector’s response should be proportional, or linear • The linearity may be affected by stray light, problems with the detector, amplifier, monochromator, or readout device • Noise, or background electrical signals that produce random spikes in electronics, can interfere with analyte measurements at low concentrations • Resolution is the ability to distinguish individual peaks in the absorbance spectrum from one another