Download
1 / 29
290 likes | 293 Views
CHAMELEON: A Hierarchical Clustering Algorithm Using Dynamic Modeling. Outline. Motivation Objective Research restrict Literature review An overview of related clustering algorithms The limitations of clustering algorithms CHAMELEON Concluding remarks Personal opinion. Motivation.

E N D
CHAMELEON: A Hierarchical Clustering Algorithm Using Dynamic Modeling
Outline • Motivation • Objective • Research restrict • Literature review • An overview of related clustering algorithms • The limitations of clustering algorithms • CHAMELEON • Concluding remarks • Personal opinion
Motivation • Existing clustering algorithms can breakdown • Choice of parameters is incorrect • Model is not adequate to capture the characteristics of clusters • Diverse shapes, densities, and sizes
Objective • Presenting a novel hierarchical clustering algorithm – CHAMELEON • Facilitating discovery of natural and homogeneous • Being applicable to all types of data
Research Restrict • In this paper, authors ignored the issue of scaling to large data sets that cannot fit in the main memory
Literature Review • Clustering • An overview of related clustering algorithms • The limitations of the recently proposed state of the art clustering algorithms
Clustering • The intracluster similarity is maximized and the intercluster similarity is minimized [Jain and Dubes, 1988] • Serving as the foundation for data mining and analysis techniques
Clustering(cont’d) • Applications • Purchasing patterns • Categorization of documents on WWW [Boley, et al., 1999] • Grouping of genes and proteins that have similar functionality[Harris, et al., 1992] • Grouping if spatial locations prone to earth quakes[Byers and Adrian, 1998]
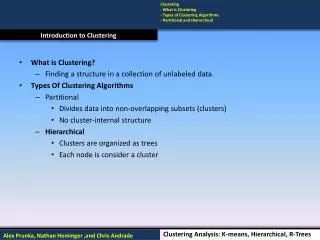
An Overview of Related Clustering Algorithms • Partitional techniques • Hierarchical techniques
Partitional Techniques • K means[Jain and Dubes, 1988]
Hierarchical Techniques • CURE [Guha, Rastogi and Shim, 1998] • ROCK [Guha, Rastogi and Shim, 1999]
Limitations of Existing Hierarchical Schemas • CURE • Fail to take into account special characteristics
Limitations of Existing Hierarchical Schemas(cont’d) • ROCK • Irrespective of densities and shapes
CHAMELEON • Overview • Modeling the data • Modeling the cluster similarity • A two-phase clustering algorithm • Performance analysis • Experimental Results
Modeling the Data • K-nearest graphs from an original data in 2D
Modeling the Cluster Similarity • Relative inter-connectivity
Modeling the Cluster Similarity(cont’d) • Relative closeness
A Two-phase Clustering Algorithm • Phase I: Finding initial sub-clusters
A Two-phase Clustering Algorithm(cont’d) • Phase I: Finding initial sub-clusters • Multilevel paradigm[Karypis & Kumar, 1999] • hMeT|s [Karypis & Kumar, 1999]
A Two-phase Clustering Algorithm(cont’d) • Phase II: Merging sub-clusters using a dynamic framework TRI, TRC: user specified threshold
A Two-phase Clustering Algorithm(cont’d) • Phase II: Merging sub-clusters using a dynamic framework
Performance Analysis • The amount of time required to compute • K-nearest neighbor graph • Two-phase clustering
Performance Analysis(cont’d) • The amount of time required to compute • K-nearest neighbor graph • Low-dimensional data sets = O(n log n) • High-dimensional data sets = O(n2)
Performance Analysis(cont’d) • The amount of time required to compute • Two-phase clustering • Computing internal inter-connectivity and closeness for each cluster: O(nm) • Selecting the most similar pair of cluster: O(n log n + m2 log m) • Total time = O(nm + n log n + m2 log m)
Experimental Results • Program • DBSCAN: a publicly available version • CURE: a locally implemented version • Data sets • Qualitative comparison
Data Sets • Five clusters • Different size, shape, and density • Noise point • Two clusters • Close to each other • Different region, different densities • Six clusters • Different size, shape, and orientation • Random noise point • Special artifacts • Eight clusters • Different size, shape, density, and orientation • Random noise point • Eight clusters • Different size, shape, and orientation • Random noise and special artifacts
Concluding remarks • CHAMELEON can discover natural clusters of different shapes and sizes • It is possible to use other algorithms instead of k-nearest neighbor graph • Different domains may require different models for capturing closeness and inter-connectivity
Personal Opinion • Without further work