Download
1 / 17
170 likes | 174 Views
Cooperative Institute for Research in Environmental Sciences. University of Colorado. Exploring Arctic Climate Change with NSIDC Data. Walt Meier Research Scientist Climate Literacy & Energy Awareness Network June 8, 2011. http://nsidc.org.

E N D
Cooperative Institute for Research in Environmental Sciences University of Colorado Exploring Arctic Climate Change with NSIDC Data Walt Meier Research Scientist Climate Literacy & Energy Awareness Network June 8, 2011 http://nsidc.org
National Snow and Ice Data Center • Part of the University of Colorado at Boulder • NOAA Cooperative Institute for Research in Environmental Sciences (CIRES) • NASA archive center for cryospheric data • Funding and responsibilities • ~75% data management • ~75 TB of data total, ~15 TB/year • ~25% research • Main sponsors:
The Cryosphere Snow and ice spans the globe, from the equator to the poles. The cryosphere is found in over 100 countries Countries affected by the cryosphere Integrated Global Observing Strategy (IGOS) Cryosphere Theme Report
Change in the cryosphere: Summer Arctic sea ice extent is declining -11.5% per decade 1979-2000 Average 2007: 39% below average 2008: 34% below average 2009: 24% below average 2010: 30% below average NSIDC Sea Ice Index, http://nsidc.org/data/seaice_index/
Resources: • NSIDC: • Data on Google Earth: http://nsidc.org/data/virtual_globes/ • Education Center: http://nsidc.org/cryosphere/ • “All About” pages, “State of the Cryosphere” • Arctic Sea Ice News & Analysis: http://nsidc.org/arcticseaicenews/ • “Icelights”: http://nsidc.org/icelights/ • Companion to news page – more in depth info on topical sea ice issues • Sea Ice Index: http://nsidc.org/data/seaice_index/ • Atlas of the Cryosphere: http://nsidc.org/data/atlas/ • Selected other sites: • “Whither Arctic Sea Ice?” EET Chapter: http://serc.carleton.edu/eet/seaice/ • “Windows on the Universe” Sea Ice: http://www.windows2universe.org/teacher_resources/graphs/teach_sea_ice_extent.html • A Tour of the Cryosphere, NASA Scientific Visualization Studio: http://www.nasa.gov/multimedia/podcasting/TourOfCryosphere09.html • NOAA Arctic Theme Page: http://www.arctic.noaa.gov/ • Snowtweets: http://snowcore.uwaterloo.ca/snowtweets/
NSIDC data on Google Earth • Sea ice • Animation and static images • Snow • Permafrost • Glaciers • Glacier pair photos New: Climate Change Tour of Cold Places – narrated tour of snow and ice http://nsidc.org/data/virtual_globes/tours/NSIDC_ClimateChangeTour.kml http://nsidc.org/data/virtual_globes/
NSIDC Education Center • NSIDC Education Center • Background info on: • Sea ice • Glaciers • Snow • Frozen ground • Arctic climate http://nsidc.org/cryosphere/
NSIDC Arctic Sea Ice News and Analysis • Track Arctic sea ice daily • Monthly interpretation of conditions • More frequent posts during summer http://nsidc.org/arcticseaicenews/
NSIDC “Icelights” • Highlight current sea ice research • Address common questions http://nsidc.org/icelights/
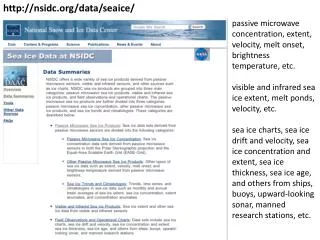
NSIDC Sea Ice Index • Daily/month images and data • Extent • Concentration • Anomalies • Compare and animate images • Total extent text values since 1979 http://nsidc.org/data/seaice_index/
NSIDC resources Atlas of the Cryosphere, http://nsidc.org/data/atlas/ WMS, OCG compliant web map server Several Arctic (static) layers – sea ice snow, permafrost, snow, geographic locations http://nsidc.org/data/atlas/
Whither Arctic Sea Ice?Using Sea Ice Data in the Classroom AccessData Earth Exploration Toolbook chapter http://serc.carleton.edu/eet/seaice/ Developed by: Walt Meier National Snow and Ice Data Center, Univ. Colorado Coop. Inst. for Research in Environmental Sciences Betsy Youngman Phoenix Country Day School Mark McCaffrey Coop. Inst. for Research in Environmental Sciences Anupma Prakash Geophysical Institute, University of Alaska Fairbanks Brian Rogan Boston Museum of Science http://nsidc.org/data/atlas/
An Arctic in Transformation Whither Arctic Sea Ice?Using Sea Ice Data in the Classroom • Use satellite data of sea ice to analyze trends and variability, 1979-present • Case studies for various regions • Impacts on people/wildlife • Hudson Bay developed, others possible • Imagery and animations for qualitative analysis • Quantitative data for more involved analysis • Uses ImageJ (freeware) for data/image analysis and processing • MS Excel or other spreadsheet for further data analysis http://serc.carleton.edu/eet/seaice/
Windows on the Universe • Same data as Whither Arctic Sea Ice • Similar method, but more basic
NASA “A Tour of the Cryosphere” • Video podcast • NASA data of the cryosphere • Updated in 2009
NOAA Resources on Arctic climate NOAA Arctic Change, http://www.arctic.noaa.gov/
SnowTweets Project R. Kelly, Univ. Waterloo, http://snowcore.uwaterloo.ca/snowtweets/