Download
1 / 24
240 likes | 324 Views
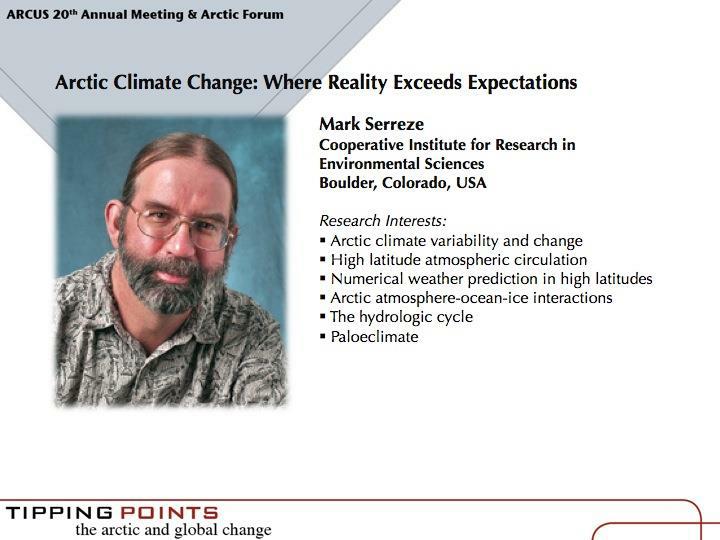
Arctic Climate Change: Where Reality Exceeds Expectations. Mark C. Serreze National Snow and Ice Data Center (NSIDC) Cooperative Institute for Research in Environmental Sciences at the University of Colorado at Boulder.

E N D
Arctic Climate Change: Where Reality Exceeds Expectations Mark C. SerrezeNational Snow and Ice Data Center (NSIDC)Cooperative Institute for Research in Environmental Sciences at the University of Colorado at Boulder Special Thanks: Julienne Stroeve, Andy Barrett, Ted Scambos, Drew Slater, Dave Lawrence, Tingjun Zhang
July, 1982: Global Warming? Bah!! Ellesmere Island, near Lake Hazen
Arctic Amplification IPCC 2007
Loss of Near-Surface Permafrost Lawrence and Slater, 2005
Acceleration of the Freshwater Cycle Left: changes in multi-model mean freshwater budget terms for the Arctic Ocean with respect to 1950-1980 means: positive anomalies indicate an increasing source (or decreasing sink) of freshwater for the Arctic Ocean Holland et al. 2007; Serreze et al. 2006
Arctic sea ice is disappearing Stroeve et al. 2008
Observed rate of loss is faster than expected Adapted from Stroeve et al., 2007
The Northwest Passage: open by late August 2007 Gjoa1903 Manhattan1968 Cloud Nine2007 G. Spreen, L. Kaleschke, and G. Heygster/IUP Universitat Bremen, AMSR data from National Snow and Ice Data Center (left); unknown (upper right); Dave Kavanagh (middle right); D. Thoreson (lower right)
Model-Projected Arctic Amplification Model projection of 2-meter temperature anomalies by month and year for 70–90 degrees North latitude, compared to 1979–2007 means (CCSM3) Latitude by height dependence of zonally averaged October–March temperature anomalies for 2050–2059, compared to 1979–2007 means (CCSM3) Mark Serreze, Andy Barrett, Marika Holland
Arctic amplification has emerged Temperature anomalies, 2003–2007 minus 1979–2007 October NCEP/NCAR, Climate Diagnostics Center
Observed Autumn Temperature Trends, 1960-2007 GISS Analysis
Greenland’s Changing Mass Budget W. Abdalati
Surface Melt and the “Zwally Effect” K. Steffen, M. Tedesco
Greenland’s Largest Glacier: Acceleration and Retreat Ian Howat, Ian Joughin, Ted Scambos
Warming Permafrost Russian Permafrost Temperature 4 0.2 m; Trend = +0.78°C/decade 0.4 m; Trend = +0.79°C/decade 3 0.8 m; Trend = +0.65°C/decade 1.6 m; Trend = +0.55°C/decade 2 3.2 m; Trend = +0.66°C/decade 1 Temperature Departure (°C) 0 -1 -2 -3 -4 1950 1955 1960 1965 1970 1975 1980 1985 1990 1995 2000 Year Alaska:4 to 6°C increase in 20th Century, 2 to 3°C in the last 30 years Siberia:>3°C increase from mid-1950s to 1990 Canadian Arctic:1 to 3°C increase in past several decades Tibetan Plateau:up to 1.0°C increase since 1970s IPCC 2007
Infrastructure Impacts Chersky, Russia Alaska Thermokarst in Yakutsk, Russia (Skiklomanov, 2005). Qinghai-Xizang Highway bridge collapse
Methane Release from Arctic Lakes Methane bubbles trapped in lake ice Lakes boiling with methane in the Arctic Burning methane over a thermokarst lake in Siberia (K. Walter)
Seasonally frozen layer Active layer Talik (layer of unfrozen ground) Permafrost Permafrost Talik Formation
Changes in Shrub Abundance: Chandler River, AK 1949 Chandler River, 50 miles S. of Umiat: Sturm, Racine and Tape: Fifty Years of Change in Arctic Alaskan Shrub Abundance
Concluding Comments • Even our earliest climate models projected that effects of greenhouse gas loading would be seen first in the Arctic. • Even eight years ago, attribution of observed changes was uncertain. • Despite strong imprints of natural variability, a role of greenhouse greenhouse gas loading now seems clear • A number of key changes are exceeding expectations from climate models. Could we lose the summer sea ice cover by 2030? • Not everything is rapidly changing (hydrologic cycle). • Much remains to be understood—the idea of “tipping points” has emerged as a key issue.