Download
1 / 16
160 likes | 334 Views
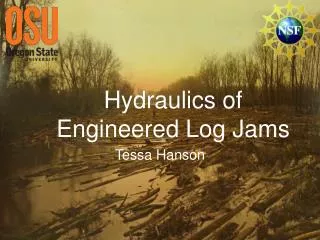
Wavelet Analysis for Engineered Log Jams. William Chen Eco-informatics Summer Institute 22 August 2013. Goal. To create an informed set of wavelet data that may be quickly analyzed by scientists working on Fish-ELJ data.

E N D
Wavelet Analysis for Engineered Log Jams William Chen Eco-informatics Summer Institute 22 August 2013
Goal • To create an informed set of wavelet data that may be quickly analyzed by scientists working on Fish-ELJ data. • We want to determine where fish like to reside near a log jam, but first we need to figure where the distribution of energy around a log jam. Wavelet analysis can help in this respect. • Do fish like to stay in large eddies lower in the energy spectrum?
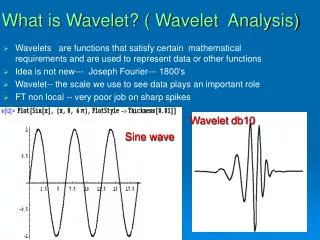
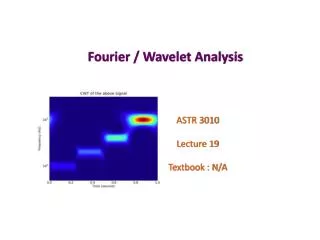
Background • In general, wavelets are oscillating patterns with zero mean (Torrence et al); eddies are the swirling of fluid past large obstacles (Benitez-Nelson). Source: Wikimedia Commons
Background (con’t) • For our purposes, we are looking at are oscillating patterns in a time series of velocities at a single location. • Patterns in the time series can be interpreted as a transformation of any wavelet, the wavelet in question being the analyzing wavelet. • By analyzing the quantitative properties of these patterns, we can gain insight into the energy properties of a different locations.
Background (con’t) cm/s s
Scales Source: http://registry.gimp.org/node/11742 Source: “Continuous Wavelet Transform”
Background (con’t) • Scales are scalar quantities that represent factors of stretching and compression on a wavelet for “level”. Can be thought of as the “frequency” of wavelet. (“Continuous Wavelet Transform”)
Background (con’t) • Large eddies tend to occur at low wave numbers, i.e. lower scales (Gibson). This makes sense because larger eddies would have more energy contained in them due to their size.
What We Need • We want a data set to hold outputs of wavelet analysis. • Why? High intellectual overhead • Computational overhead • In Matlab, we can do a continuous wavelet transform, from which Matlab will generate scales and their coefficients. (“Continuous Wavelet Transform”) • The scales can be converted (or correlated) to frequencies/wave numbers • The coefficients can be mapped to scales to generate an energy spectrum
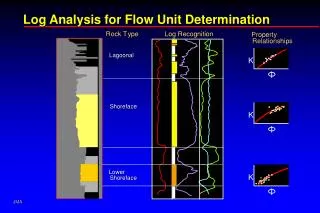
Data Collection • Data was collected around an engineered log jam at the Oregon Hatchery Research Center • Velocity data is collected at 0.1 m spatial intervals over a grid • The data in each point in space is saved as a single semicolon separated file
Data Processing Method • Language used: Matlab • Tested on Windows 8 • We import the time series data and correlate them to a spatial location on the grid. • The coordinates of each point, its energy information, the energy’s wavelet scales and coefficients are output to a CSV file. • The data can be easily opened later and imported into Matlab or another programming/data analysis environment for study.
Implications • Further processing of the generated data can help produce a visualization of the energy spectrum of the data. • A visualization will help us reach a conclusion on the distribution of energy around log jams, and when mapped with fish count data, this can be used to determine where fish like to reside.
Acknowledgements • Professor Desiree Tullos • Sean McGregor • William L’Hommedieu • Cara Walter • Professor Julia Jones • Professor Tom Dietterich • Amanda Reinholtz • Peggy Lee
Sources • Benitez-Nelson, C. (n.d.). What are eddies? Retrieved from http://www.geol.sc.edu/cbnelson/eddy/eddy.htm • Gibson, M. (2011). Turbulence. Thermopedia, doi: 10.1615/AtoZ.t.turbulence • Torrence, C., Gilbert P. Compo (1998): A Practical Guide to Wavelet Analysis. Bull. Amer. Meteor. Soc., 79, 61–78. • Continuous Wavelet Transform - MATLAB & Simulink.MathWorks. Retrieved from http://www.mathworks.com/help/wavelet/gs/continuous-wavelet-transform.html