Download

1 / 25
300 likes | 497 Views
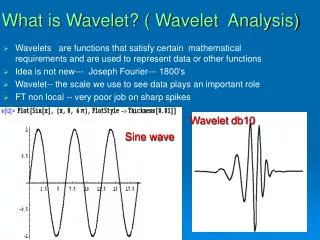
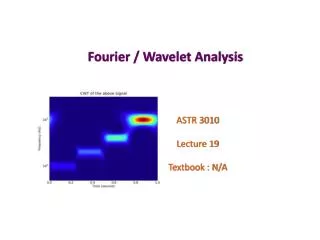
Wavelet Spectral Analysis. Ken Nowak 7 December 2010. Need for spectral analysis. Many geo-physical data have quasi-periodic tendencies or underlying variability Spectral methods aid in detection and attribution of signals in data. Fourier Approach Limitations. Results are limited to global

E N D
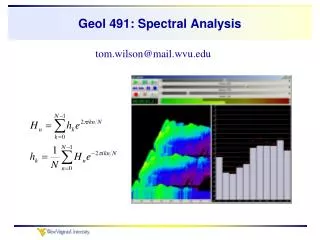
Wavelet Spectral Analysis Ken Nowak 7 December 2010
Need for spectral analysis • Many geo-physical data have quasi-periodic tendencies or underlying variability • Spectral methods aid in detection and attribution of signals in data
Fourier Approach Limitations • Results are limited to global • Scales are at specific, discrete intervals • Per fourier theory, transformations at each scale are orthogonal
Wavelet Basics Function to analyze Morlet wavelet with a=0.5 Integrand of wavelet transform |W(a=0.5,b=6.5)|2=0 |W(a=0.5,b=14.1)|2=.44 ∫ Wf(a,b)= f(x)y(a,b) (x) dx Wavelets detect non-stationary spectral components õ b=2 b=6.5 b=14.1 graphics courtesy of Matt Dillin
Wavelet Basics • Here we explore the Continuous Wavelet Transform (CWT) • No longer restricted to discrete scales • Ability to see “local” features Mexican hat wavelet Morlet wavelet
Global Wavelet Spectrum function Global wavelet spectrum Wavelet spectrum a=2 |Wf (a,b)|2 a=1/2 Slide courtesy of Matt Dillin
Wavelet Details • Convolutions between wavelet and data can be computed simultaneously via convolution theorem. Wavelet transform Wavelet function All convolutions at scale “a”
Analysis of Lee’s Ferry Data • Local and global wavelet spectra • Cone of influence • Significance levels
Analysis of ENSO Data Characteristic ENSO timescale Global peak
Significance Levels Background Fourier spectrum for red noise process (normalized) Square of normal distribution is chi-square distribution, thus the 95% confidence level is given by: Where the 95th percentile of a chi-square distribution is normalized by the degrees of freedom.
Scale-Averaged Wavelet Power • SAWP creates a time series that reflects variability strength over time for a single or band of scales
Band Reconstructions • We can also reconstruct all or part of the original data
Lee’s Ferry Flow Simulation • PACF indicates AR-1 model • Statistics capture observed values adequately • Spectral range does not reflect observed spectrum
WARM and Non-stationary Spectra Power is smoothed across time domain instead of being concentrated in recent decades
Wavelet Phase and Coherence • Analysis of relationship between two data sets at range of scales and through time Correlation = .06
Cross Wavelet Transform • For some data X and some data Y, wavelet transforms are given as: • Thus the cross wavelet transform is defined as:
Phase Angle • Cross wavelet transform (XWT) is complex. • Phase angle between data X and data Y is simply the angle between the real and imaginary components of the XWT:
Coherence and Correlation • Correlation of X and Y is given as: Which is similar to the coherence equation:
Summary • Wavelets offer frequency-time localization of spectral power • SAWP visualizes how power changes for a given scale or band as a time series • “Band pass” reconstructions can be performed from the wavelet transform • WARM is an attractive simulation method that captures spectral features
Summary • Cross wavelet transform can offer phase and coherence between data sets • Additional Resources: • http://paos.colorado.edu/research/wavelets/ • http://animas.colorado.edu/~nowakkc/wave