Download
1 / 5
50 likes | 133 Views
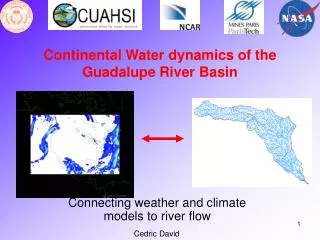
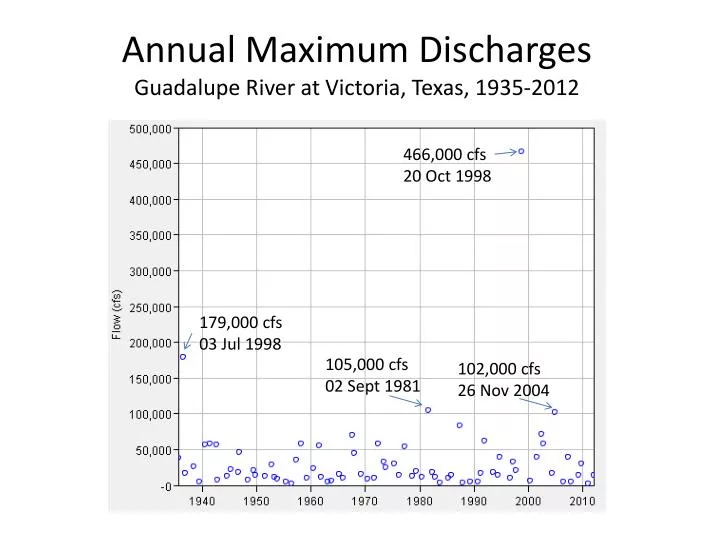
Annual Maximum Discharges Guadalupe River at Victoria, Texas, 1935-2012. 466,000 cfs 20 Oct 1998. 179,000 cfs 03 Jul 1998. 105,000 cfs 02 Sept 1981. 102,000 cfs 26 Nov 2004. Frequency Analysis, 1935-1978. Frequency Analysis, 1935-2012. Comparison of Two Analyses.

E N D
Annual Maximum Discharges Guadalupe River at Victoria, Texas, 1935-2012 466,000 cfs 20 Oct 1998 179,000 cfs 03 Jul 1998 105,000 cfs 02 Sept 1981 102,000 cfs 26 Nov 2004
Comparison of Two Analyses • 1935-1978 (44 years) • Mean 4.278 • StdDev 0.404 • Skew -0.085 • Design discharges • 10 yr 61,929 cfs • 100 yr 155,880 cfs • 500 yr 250,962 cfs • 1935-2012 (78 years) • Mean 4.268 • StdDev 0.457 • Skew 0.188 • Design discharges • 10 yr 72,760 cfs • 100 yr 247,472 cfs • 500 yr 487,051 cfs
Comparison of Design DischargesGuadalupe River at Victoria, Texas 1935-2012 (78 years) 1935-1978 (44 years)