Download
1 / 40
400 likes | 557 Views
Surface Water Hydrology at White River Lake, Texas. Presented by Shane Walker May 3, 2005 CE 392K.2 – Hydrology. Motivation. Water Scarcity People Need Water. Ground Water. Surface Water. Outline. Background Info Model Development Geometry Evaporation & Usage Results.

E N D
Surface Water HydrologyatWhite River Lake, Texas Presented by Shane Walker May 3, 2005 CE 392K.2 – Hydrology
Motivation • Water Scarcity • People Need Water Ground Water Surface Water
Outline • Background Info • Model Development • Geometry • Evaporation & Usage • Results
Background Information Who, Where, What, When, Why, How
Who? • White River Municipal Water District • Established in 1967 • Post, Crosbyton, Ralls, Spur, & White River • Services < 10,000 people
Who? • White River Water Treatment Plant • Provides “Superior” drinking water to the MWD • Source: surface water from White River Lake • Average Annual effluent: 1.7 MGD • Maximum effluent: 4.5 MGD
Who? • White River Lake • Constructed: 1962-1964 • Inflow: White River (intermittent) • Full Elevation: 2372 ft • Full Depth: 45 ft • Full Volume: 31,846 acre-ft • Full Area: 2.5 sq. mi.
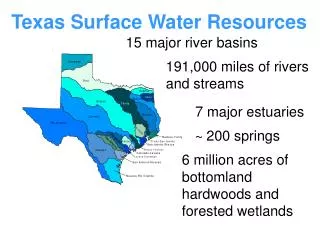
Where? • White River Lake • ~ 40 mi. E of Lubbock
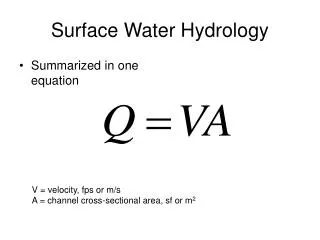
What? • Software program to predict the usable life of the Lake • Dependent upon evaporation and usage
Why? • Lake Depletion – rationing vs. alternative source?
How? • develop mathematical model of the geometry of the lake • values for evaporation and usage • develop software to predict usable life
Model Development Geometry Evaporation & Usage
Volume/Depth Regression Mathematical Model Of Lake Geometry
Data • Volumetric Survey of White River Lake • June 30, 1993 • prepared by the Hydrographic Survey Group • published by the Texas Water Developement Board • Sonar/Sounding • Surface area vs. Elevation @ 0.1 ft interval
Analysis • Input data into Microsoft Excel • Used built-in regression tools • Determined accuracy of correlation by R2
Results • Determined best fit as Power function • V(D) = 5.3412 D2.2933 • D(V) = 0.4827 V0.4358 • (R2 ~0.999) – Good considering siltation
Evaporation & Usage Water Consumption Data
Evaporation 6.2 ft
Domestic/Industrial Usage • Industrial • Oil Companies flood oil wells • Decreasing • Compare Domestic versus Industrial
Assumptions • No Infiltration (clay soils) • No precip or inflow (conservative)
Lake Level Model Evaporation & Usage
Lake Level Model Start Elevation – Evap – Pumpage = Final Elevation
Alternative Scenarios • Case A – No change (D = 0) • Case B – Eliminate Industrial Usage • Case C – Limit plant flow • Case D – Eliminate all usage
Lake Level Model • Input Data • Date • Full elevation • Current surface elevation • Lowest intake elevation • Lake bottom elevation
Benefits • Educate planners and managers • WRMWD • Industrial will probably not be eliminated • Simulate rationing by assuming winter usage • Applied to any reservoir (water balance)
Model Improvements • Change USDA evap to TWDB evap • Add Precipitation into the model • “Calibrate” the model to simulate dry spells
Conclusions • Consider sustainable alternative supply