Download
1 / 4
70 likes | 660 Views
ROC curve. Receiver-Operating Characteristic curve. 주어진 분류 모델에 대한 ROC 곡선을 그리기 위해서는 Sample 들이 예측 class 값에 대한 확률값이나 순위를 가져야 한다 . -> 내림차순 정렬 우선 , TPR 과 FPR 이 모두 0 인 점을 찍는다 . sample 목록의 맨 위 인스턴스부터 actual class label 을 검사한다 .

E N D
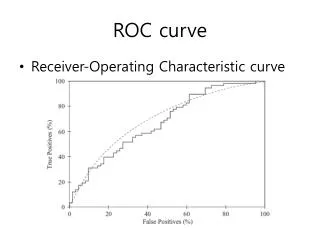
ROC curve • Receiver-Operating Characteristic curve
주어진 분류 모델에 대한 ROC 곡선을 그리기 위해서는 Sample들이 예측 class 값에 대한 확률값이나 순위를 가져야 한다. -> 내림차순 정렬 • 우선, TPR과 FPR이 모두 0인 점을 찍는다. sample 목록의 맨 위 인스턴스부터actual class label을 검사한다. -> class가 yes인 인스턴스가 제대로 분류됐다면 Y축(TPR)을 향해 위로 이동하고, no인 인스턴스를 잘못 예측했다면 x축(FPR)을 향해 오른쪽으로 이동 • Sample의 의존성을 줄이기 위해 대부분 cross-validation등의 방법을 적용한다. -> 각 test set의 TPR과 FPR을 구해 좌표 형식으로 표현할 수 있음
AUC • Area under the curve • Test set을 TPR과 FPR에 대해 오름차순으로 정렬한 후, FPR이 변하는 지점에서의 TPR 합계를 전체 negative 수로 나눈다. class FPR TPR (1+1+0.75+0.25)/4 = 0.75 http://adnoctum.tistory.com/121
1 - 1/(N*P)*(sum_{i=1}^{N} Pi) • Pi = the number of passed positive sample at ith negative point • P = total positive number • N = total negative number