Download
1 / 59
590 likes | 624 Views
Explore ROC curves, TP/FP rates, & classifier accuracy using WEKA for data mining experiments. Learn to visualize, analyze & compare classifiers on US census data.

E N D
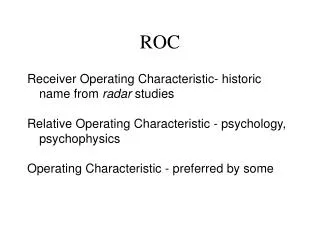
ROC curves Data Mining Lab 5
Lab outline • Remind what ROC curve is • Generate ROC curves using WEKA • Some usage of ROC curves
Point in ROC space TP rate FP rate FP rate: FP/N TP rate: TP/P (recall) FN rate: FN/N TN rate: TN/P Classifier accuracy: (TP+TN)/(P+N) Shows how good is classifier in discriminating positive instances from negative ones
ROC curve of a probabilistic classifier Naïve Bayes, for example, outputs the probability of an instance in a testing set to be classified as YES
ROC curve of a probabilistic classifier In a general case, we classify an instance as YES if the probability is more than 50% Classified as YES Classified as NO Operating threshold
ROC curve of a probabilistic classifier We compute the confusion matrix And the TP and FP rates: TP rate: TP/P=2/3≈0.7 FP rate: FP/N=1/4=0.25
ROC curve of a probabilistic classifier 1 TP rate A 1 FP rate This corresponds to point A in a ROC space FP rate: FP/N=1/4=0.25 TP rate: TP/P=2/3≈0.7
ROC curve of a probabilistic classifier 1 For different threshold values we get different points in a ROC space TP rate 1 FP rate FP rate: FP/N=0/4=0 TP rate: TP/P=1/3≈0.3
ROC curve of a probabilistic classifier 1 For different threshold values we get different points in a ROC space TP rate 1 FP rate FP rate: FP/N=0/4=0 TP rate: TP/P=2/3≈0.7
ROC curve of a probabilistic classifier 1 For different threshold values we get different points in a ROC space TP rate 1 FP rate FP rate: FP/N=1/4=0.25 TP rate: TP/P=2/3≈0.7
ROC curve of a probabilistic classifier 1 For different threshold values we get different points in a ROC space TP rate 1 FP rate FP rate: FP/N=1/4=0.25 TP rate: TP/P=3/3=1.0, etc…
ROC curve of a probabilistic classifier 1 TP rate 1 FP rate At the end we get the ROC curve for Naïve Bayes classifier
ROC curve of a probabilistic classifier vs discrete classifier 1 1 TP rate TP rate 1 FP rate 1 FP rate ROC curve for Naïve Bayes classifier (probabilistic) ROC curve for Decision Tree classifier (discrete)
Lab outline • Remind what ROC curve is • Generate ROC curves using WEKA • Some usage of ROC curves
Preparation Step 1. Increase Java heap size Step 2. Download input data file into your home directory
Knowledge flow tabs EVALUATION FILTERS DATA SOURCES CLASSIFIERS VISUALIZATION
Loading the data Click
Loading the data Select file adult_income.arff
Data file adult_income.arff @relation adults • @attribute age numeric • @attribute workclass {Private, Self-emp-not-inc, Self-emp-inc, Federal-gov, Local-gov, State-gov, Without-pay, Never-worked} • @attribute education real • @attribute marital_status {Married-civ-spouse, Divorced, Never-married, Separated, Widowed, Married-spouse-absent, Married-AF-spouse} • @attribute occupation {Tech-support, Craft-repair, Other-service, Sales, Exec-managerial, Prof-specialty, Handlers-cleaners, Machine-op-inspct, Adm-clerical, Farming-fishing, Transport-moving, Priv-house-serv, Protective-serv, Armed-Forces} • @attribute sex {Male, Female} • @attribute native_country {United-States, Cambodia, England, Puerto-Rico, Canada, Germany, Outlying-US(Guam-USVI-etc), India, Japan, Greece, South, China, Cuba, Iran, Honduras, Philippines, Italy, Poland, Jamaica, Vietnam, Mexico, Portugal, Ireland, France, Dominican-Republic, Laos, Ecuador, Taiwan, Haiti, Columbia, Hungary, Guatemala, Nicaragua, Scotland, Thailand, Yugoslavia, El-Salvador, Trinadad&Tobago, Peru, Hong, Holand-Netherlands} • @attribute class {>50K, <=50K} Data from US census
Attributes of interest: age, education, class (income >50 K: YES,NO) 1. @attribute age numeric 3. @attribute education real last @attribute class {>50K, <=50K} Numeric codes for education levels Doctorate,16 Prof-school, 15 Masters, 14 Bachelors, 13 Assoc-acdm, 12 Assoc-voc, 11 Some-college, 10 HS-grad, 9 11th, -7 12th, 8 10th, 6 9th, 5 7th-8th, 4 5th-6th,3 1st-4th, 2 Preschool, 1 We remove all other attributes and leave only attributes 1,3, last – for simplicity We build a classifier, which predicts income based on age and education level.
Removing attributes Type Means remove all except attributes 1,3,last
Visualize the data <=50K >50K
Subdivision of the dataset into “learning” and “test” set We want to build our prediction model on the 70% of the whole dataset, and compute the ROC curve on the remaining. So, we set the TRAINTEST SPLIT MAKER (EVALUATION) in the diagram and configure its parameters.
Connecting classifier to the data We set J48 component in the diagram, we connect twicethe TRAIN TEST SPLIT MAKER to this new component: twice because we must use together the training and the test set which are produced by the same component.
Show classification results (decision tree) Assoc-acdm Masters
Adding separate performance evaluator for Naïve Bayes classifier
Connecting second performance evaluator to the same Model Performance Chart