Download
1 / 17
190 likes | 370 Views
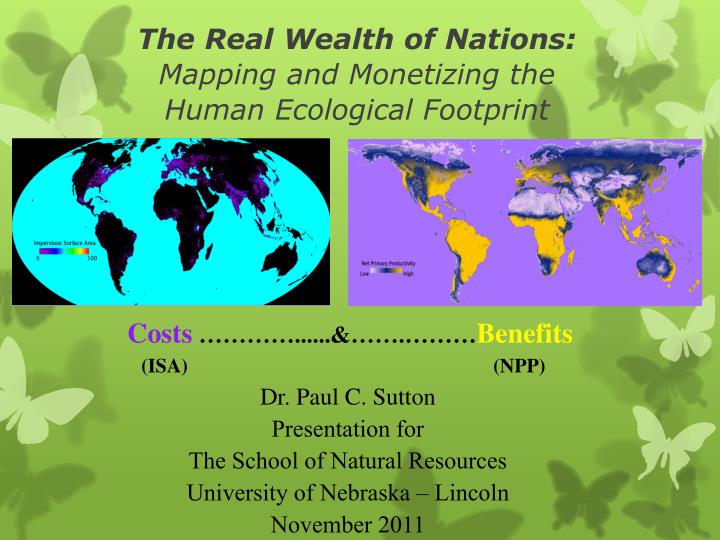
The Real Wealth of Nations: Mapping and Monetizing the Human Ecological Footprint. Costs …………......&…….……… Benefits (ISA) (NPP). Dr. Paul C. Sutton Presentation for The School of Natural Resources University of Nebraska – Lincoln November 2011.

E N D
The Real Wealth of Nations: Mapping and Monetizing theHuman Ecological Footprint Costs …………......&…….………Benefits (ISA)(NPP) Dr. Paul C. Sutton Presentation for The School of Natural Resources University of Nebraska – Lincoln November 2011
Approach and Assumptions • The impact of Human Activity on the earth can be mapped and monetized using Impervious Surface Area as a proxy. • The value of the world’s ecosystem services can be mapped and monetized using Net Primary Productivity as a proxy. • Human Impact is Balanced with Ecosystem Service at the Global Scale and valued at roughly the global GDP of $50 Trillion.
Global Estimates of ISA have been developed using simple OLS models derived from DMSP nighttime imagery and LandScan Population Density
These Models are applied Globally Christopher Elvidge; Benjamin Tuttle; Paul C. Sutton; Kimberly E. Baugh; Ara T. Howard; Christina Milesi; Budhendra Bhuduri, Ramakrishna Nemani (2007) Global Distribution and density of Constructed Impervious Surfaces Sensors 2007, 7, pp 1962-1979
Our work suggests Impervious Surface Area (ISA) is a reasonable proxy measure of Ecological Footprint Impervious Surface Area per Person vs. ecological footprint per person for 149 countries using Ecological Footprint Data from Wackernagel et. Al.
Mapping the Dollar Value of Ecosystem Services • Valuation and mapping of ecosystem service is a contested and challenging enterprise. • We chose to use Net Primary Productivity (NPP) as a proxy of ecosystem service value because it is an interesting proxy of where solar energy conversion takes place. • Other measures based on land cover, biome, spatial context etc. could also be explored. Costanza, R; d’Arge, R; de Groot, R; Farber, S; Grasso, M; Hannon, B; Naeem, S; Limburg, K; Paruelo, J; O’Neill, R; Raskin, R; Sutton, P; van den Belt, M; (1997) The Value of the World’s Ecosystem Services and Natural Capital Nature Vol 387 May 15
Global Datasets of Net Primary Productivity have been developed and explored Imhoff, Marc L., Lahouari Bounoua, Taylor Ricketts, Colby Loucks, Robert Harriss, and William T. Lawrence. 2004. Global patterns in human consumption of net primary production. Nature, 429, 24 June 2004: 870-873.
This is hopefully a provocative exercise exploring ideas of carrying capacity, I = P*A*T, Ecological Footprints, Ecosystem Service Valuation, and Sustainable Development We simply allocate $50 Trillion of ‘COST’ via the Global Map of Impervious Surface and allocate $50 Trillion of ‘Benefit’ via the Global Map of NPP. The rationale for equivalence is an assumption that we are at some sort of ‘Carrying Capacity’. The rationale for $50 Trillion is it is roughly equivalent to the Global Annual Gross Domestic Product. Wackernagel, M. and Rees, W., 1996, Our Ecological Footprint: Reducing Human Impact on the Earth. New Society Publishers, Gabriola Island, BC Canada. 176 p. ISBN: 9780865713123.
Spatially Explicit Representation of$ Value of NPP - $ Cost of Impervious Surface Next few slides are national aggregations of $ NPP, $ ISA, & Difference
Aggregate National Map of Dollar Benefit of Ecosystem Services using NPP proxy
Aggregate National Map of Dollar Cost of Human impact using ISA proxy Sutton, Paul C.; Anderson, Sharolyn, J.; Elvidge, Christopher D.; Tuttle, Benjamin, T.; Ghosh, Tilottama (2009) Paving the Planet: Impervious Surface as a Proxy Measure of the Human Ecological Footprint Progress in Physical Geography 33(4) pp. 1-18
Aggregate National Map of $ Benefit of NPP - $ Cost of ISA Sutton, Paul; Anderson, Sharolyn; Tuttle, Benjamin; Morse, Lauren (2011) The real wealth of nations: Mapping and monetizing the human ecological footprint Ecological Indicators ISSN 1470-160X, DOI: 10.1016/j.ecolind.2011.03.008.
Is this research consilient with ideas of Lester Brown regarding a ‘New Land Ethic’ “In the post-petroleum era we will be even more dependent on land than we are today.” Lester Brown The land-buying countries are mostly those whose populations have outrun their own land and water resources. Among them are Saudi Arabia (-19K/per), South Korea (-8K/per), China (-4 K/per), Kuwait (-19K/per), Libya _10K/per), India (-6 K/per), Egypt (-9k/per), Jordan(-10K/per), Qatar (-45 K/per) and the United Arab Emirates (-36K/per), Saudi Arabia is looking to buy or lease land in at least 11 countries, including Ethiopia (3K/per), Turkey (3K/per), Ukraine (3K/per), Sudan, Kazakhstan, the Philippines (3K/per), Viet Nam (3K/per), and Brazil. What is so surprising is the sheer number of land acquisition agreements that have been negotiated or are under consideration. The International Food Policy Research Institute (IFPRI) has compiled a list of nearly 50 agreements, based largely on a worldwide review of press reports. This massive acquisition of land to grow food in other countries is one of the largest geopolitical experiments ever conducted. (Plan B 4.0 Lester Brown)
Ethiopia under increasing pressure to sell landIs there such a thing as Agro-Imperialism?http://www.nytimes.com/2009/11/22/magazine/22land-t.html?pagewanted=all http://english.irib.ir/subcontinent/news/economy/ item/77363-punjab-farmers-to-cultivate-in- ethiopia-import-output-to-india China's President Hu Jintao shakes hands with Ethiopian Prime Minister Meles Zenawi in 2009 African land grab: what Indian companies do in Ethiopia is what they are not allowed to do in India http://farmlandgrab.org/post/view/19500 Are these trends a result of Ecological Deficits as we measure here?
Discussion Questions? • Does this make any sense? • Is ISA a good spatially explicit choice for the ‘cost’ of human impact? • Is NPP a good spatially explicit choice for the ‘benefits’ of ecosystem services? • Is $50 Trillion a reasonable number to use? • How big a sin is it to ignore the oceans? • Is this a fair balance with respect to ongoing population vs. consumption debates?