Download
1 / 17
170 likes | 268 Views
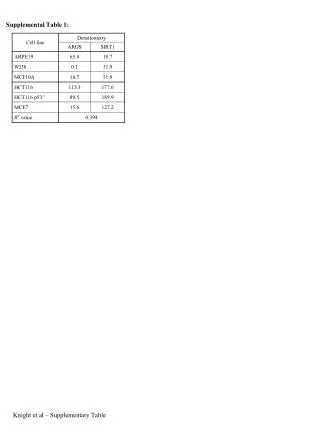
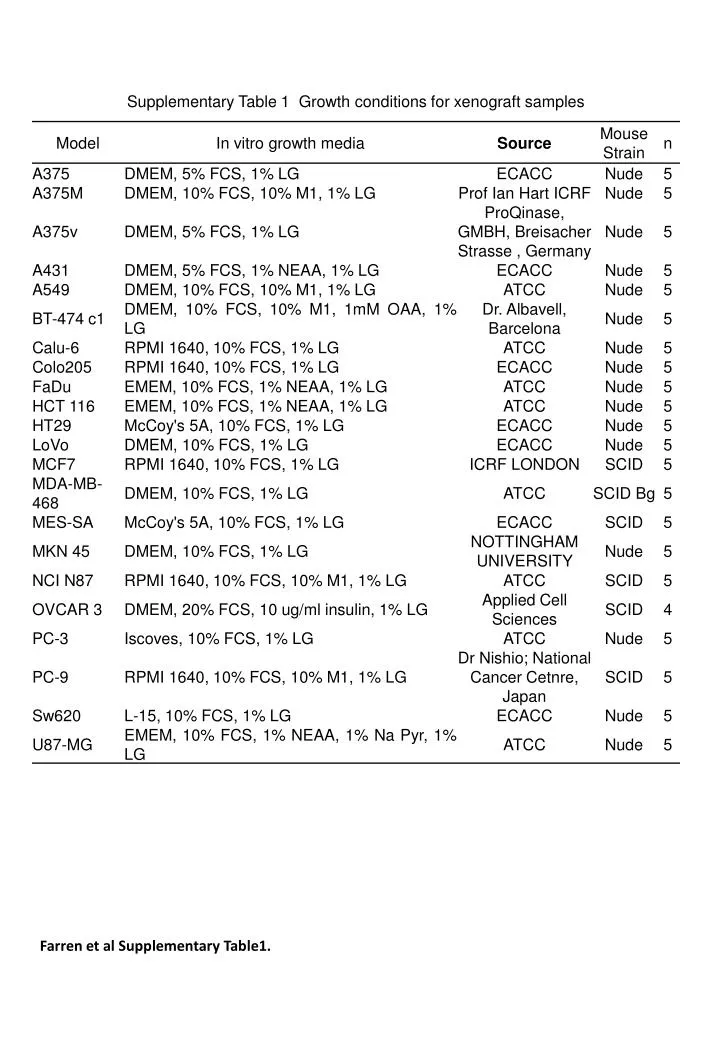
Farren et al Supplementary Table1. 1. 6. 9. 5. 7. 8. 5. 0. u. o. 5. v. 1. 9. 6. 7. 3. 9. A. 3. M. -. -. -. c. 1. 2. 0. 6. 4. 2. F. 7. 5. 3. 4. 8. D. V. R. S. 5. u. C. C. 1. T. 2. 4. 6. 3. 7. 4. 5. C. N. -. o. 4. a. l. N. 7. A. -. P.

E N D
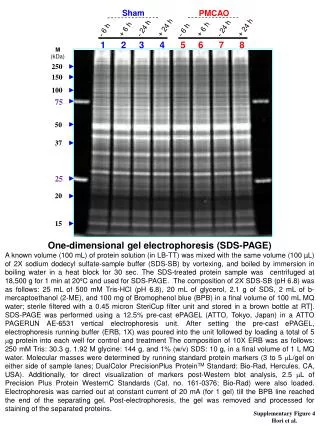
1 6 9 5 7 8 5 0 u o 5 v 1 9 6 7 3 9 A 3 M - - - c 1 2 0 6 4 2 F 7 5 3 4 8 D V R S 5 u C C 1 T 2 4 6 3 7 4 5 C N - o 4 a l N 7 A - P P o 3 S w A A A a H 7 F L T 3 I B M C l K A C E C 4 S o A C V - M M N M C H T - O A B D M a b 100 % 90 % 80 % 70 % 60 % % Human: Mouse mRNA 50 % 40 % 30 % 20 % G 10 % M - 7 8 U 0 % Human Proportion Mouse Proportion Farren et al Supplementary Figure 1
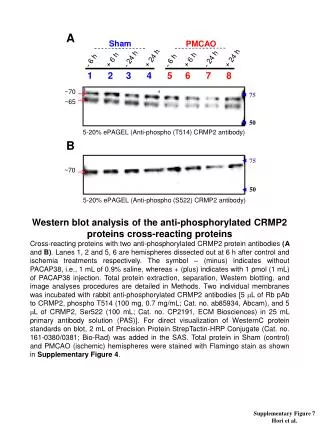
Low α-SMA staining <5% i U87MG ii LoVo iii A375M M I M iv A431 v Calu-6 vi HCT116 I M I Medium α-SMA staining 5% to 15% vii FaDu viii SW620 Iix BT474cl x HT29 E I E I xi PC9 xii Colo205 xiii A375 I E M High α-SMA staining >15% xiv A549 xv NCIN87 xvi MCF7 xvii PC3 I E E I Farren et al Supplementary Figure 3
Farren et al Supplementary Table 2; Linear regression analysis of the quantified histological staining for α-SMA, F4/80 and MVD.
Tumour PCA Scores Plot Normalised to total 18s PC-2 PC-1 Farren et al Supplementary Figure 5
A. PCA analysis of human cell line transcript profile B. PCA analysis of human xenograft transcript profile Farren et al Supplementary Figure 6.
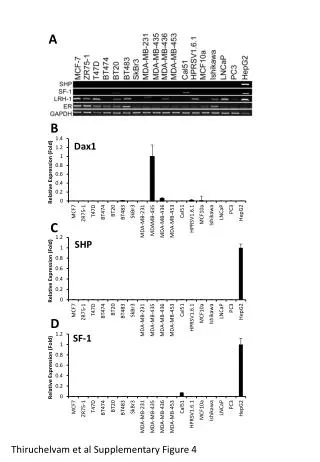
VEGF (-∆CT) ANGPT-1 (-∆CT) P Value = <0.001 R2 = 0.50 P Value = 0.004 R2 = 0.36 VEGF (log pg/ml) ANGPT-1 (log pg/ml) ANGPT-2 (-∆CT) FGF-2 (-∆CT) P Value = <0.001 R2 = 0.61 P Value = <0.001 R2 = 0.91 ANGPT-2 (log pg/ml) FGF-2 (log pg/ml) IL-8 (-∆CT) PGF (-∆CT) P Value = <0.001 R2 = 0.73 P Value = <0.001 R2 = 0.71 IL-8 (log pg/ml) PGF (log pg/ml) LoVo A375 MCF7 A375M MDA-MB-468 A375v Xenografts MES-SA A431 MKN 45 A549 NCI-N87 BT-474-c1 OVCAR 3 Calu-6 PC-3 Colo-205 PC-9 FaDu Sw620 HCT 116 U87-MG HT29 Farren et al Supplementary Figure 7
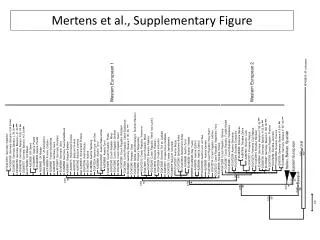
A Stromal PCA Scores Plot Normalised to total 18s PC-2 PC-1 B Stromal PCA Loading Plot Normalised to total 18s PC-2 PC-1 Farren et al Supplementary Figure 8