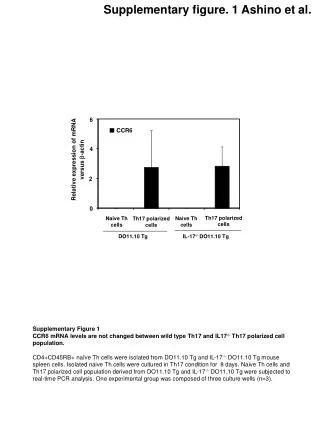
Download
1 / 7
70 likes | 187 Views
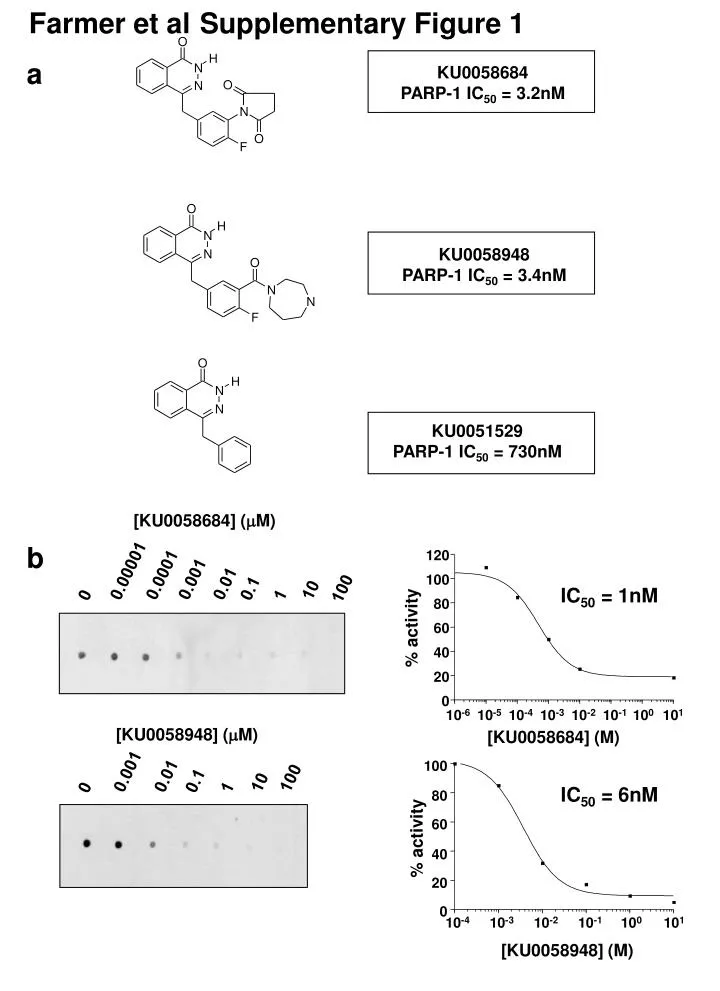
Farmer et al Supplementary Figure 1. [ KU0058684] ( M). 1. 2. 0. 1. 0. 0. IC 50 = 1nM. 0.00001. 0.0001. KU0051529 PARP-1 IC 50 = 730nM. 0.001. 0.01. 8. 0. 0.1. 100. 10. 0. 1. % activity. 6. 0. 4. 0. 2. 0. 0. 10 -6. 10 -5. 10 -4. 10 -3. 10 -2. 10 -1. 10 0.

E N D
Farmer et alSupplementary Figure 1 [KU0058684] (M) 1 2 0 1 0 0 IC50 = 1nM 0.00001 0.0001 KU0051529 PARP-1 IC50 = 730nM 0.001 0.01 8 0 0.1 100 10 0 1 % activity 6 0 4 0 2 0 0 10-6 10-5 10-4 10-3 10-2 10-1 100 101 [KU0058684] (M) [KU0058948] (M) 1 0 0 IC50 = 6nM 8 0 0.001 0.01 100 0.1 10 0 1 6 0 % activity 4 0 2 0 0 10-4 10-3 10-2 10-1 100 101 [KU0058948] (M) a KU0058684 PARP-1 IC50 = 3.2nM KU0058948 PARP-1 IC50 = 3.4nM b
Farmer et alSupplementary Figure 2 1h 4h 24h log surviving fraction log surviving fraction log surviving fraction 11CO Cre6 Cre10 log surviving fraction 0 0 10-9 10-8 10-7 10-6 10-5 10-4 0 10-9 10-8 10-7 10-9 10-6 10-5 10-8 10-4 10-7 10-6 10-5 10-4 conc (M) conc (M) conc (M) 0 10-4 10-9 10-8 10-7 10-6 10-5 conc (M) D3 Cre15 Cre24 log surviving fraction log surviving fraction log surviving fraction 0 10-7 10-6 10-5 10-4 0 10-7 10-6 10-5 10-4 0 10-7 10-6 10-5 10-4 conc (M) conc (M) conc (M) a b 1h 4h 24h log surviving fraction log surviving fraction VC8 BAC VC8 0 10-9 10-8 10-7 10-6 10-5 10-4 10-9 10-8 10-7 10-6 10-5 10-4 0 conc (M) conc (M)
Farmer et alSupplementary Figure 3 MCF7-scrambled a KU0058684 KU0058948 KU0051529 log surviving fraction log surviving fraction log surviving fraction VC8 BAC VC8 10-9 10-6 10-5 10-9 10-7 10-5 10-4 10-7 10-6 10-4 10-8 10-8 10-11 10-9 10-7 10-6 10-5 10-4 10-8 0 10-11 10-10 10-11 10-10 10-10 0 0 conc (M) conc (M) conc (M) b KU0058948 KU0051529 0 0 MCF7-3.23 log surviving fraction log surviving fraction -1 -1 0 0 10-9 10-8 10-7 10-6 10-4 10-9 10-8 10-7 10-6 10-4 10-5 10-5 conc (M) conc (M)
Brca2 wild-type Brca2 deficient Mean number of chromatid breaks Brca1 deficient Brca1 wild-type Mean number of complex chromatid rearrangements 3 3 2 2 0 10nM 1M 0 10nM 1M 0 10nM 0 10nM 1 1 0 0 Farmer et alSupplementary Figure 4 a Number per cell KU0058684 concentration
100 11CO Cre10 75 50 25 0 0 10-9 10-8 10-7 10-6 10-5 D3 Cre24 100 75 50 25 0 Farmer et alSupplementary Figure 4 b % of cells with >5 H2AX foci KU0058684 concentration (M) % of cells with >5 H2AX foci 0 10-9 10-8 10-7 10-6 10-5 KU0058684 concentration (M)
Farmer et alSupplementary Figure 4 c d 60 50 % of cells with >5 H2AX foci 40 pSUPER-eCFP-control Wild-type Brca1 deficient Brca2 deficient 30 100 90 20 80 10 70 % of cells with >5 H2AX foci 60 0 50 40 pSUPER-eCFP-Parp-1 pSUPER-eCFP-control pSUPER-eCFP-Parp-1 30 20 10 0 0 10 0 10 0 10 M KU0058684
Wild-type Brca1 deficient Brca2 deficient Wild-type 100 80 60 40 20 0 0 1 2 5 10 0 10 0 10 10 MKU0058684 MKU0051529 Farmer et alSupplementary Figure 4 e % of cells with > 5 Rad51 foci