Download
1 / 1
10 likes | 64 Views
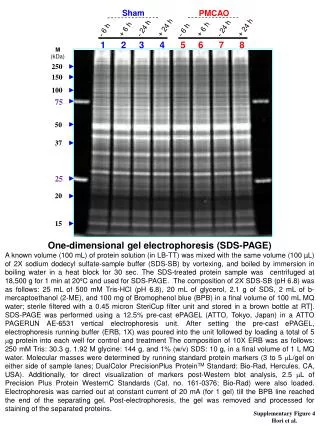
Nakayama et al. , Supplementary Figure 3. HNF4G/ACTB (microarray). HNF4G/ACTB (qRT-PCR). 0.035. 2.0. 0.030. 1.5. 0.025. 0.020. 1.0. 0.015. 0.010. 0.5. 0.005. 0.000. 0.0. SS043. SS043. SS043. SS043. SS043. SS043. SS046. SS046. SS046. SS046. SS046. SS046. SS049. SS049.

E N D
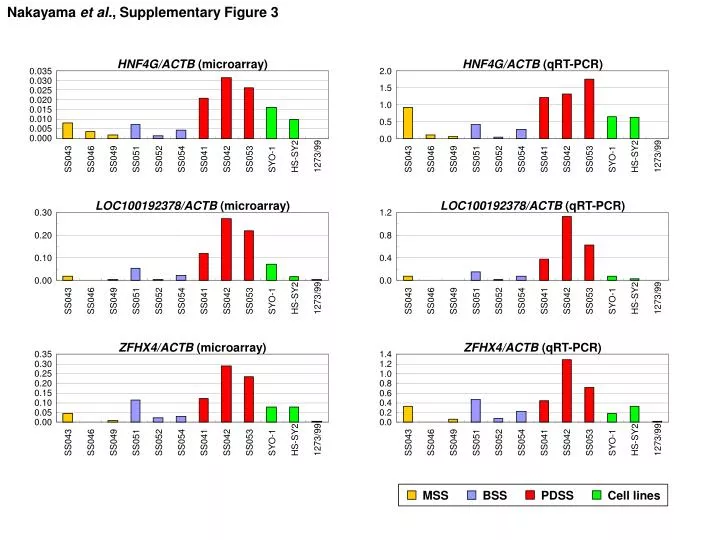
Nakayama et al., Supplementary Figure 3 HNF4G/ACTB (microarray) HNF4G/ACTB (qRT-PCR) 0.035 2.0 0.030 1.5 0.025 0.020 1.0 0.015 0.010 0.5 0.005 0.000 0.0 SS043 SS043 SS043 SS043 SS043 SS043 SS046 SS046 SS046 SS046 SS046 SS046 SS049 SS049 SS049 SS049 SS049 SS049 SS051 SS051 SS051 SS051 SS051 SS051 SS052 SS052 SS052 SS052 SS052 SS052 SS054 SS054 SS054 SS054 SS054 SS054 SS041 SS041 SS041 SS041 SS041 SS041 SS042 SS042 SS042 SS042 SS042 SS042 SS053 SS053 SS053 SS053 SS053 SS053 SYO-1 SYO-1 SYO-1 SYO-1 SYO-1 SYO-1 HS-SY2 HS-SY2 HS-SY2 HS-SY2 HS-SY2 HS-SY2 1273/99 1273/99 1273/99 1273/99 1273/99 1273/99 LOC100192378/ACTB (microarray) LOC100192378/ACTB (qRT-PCR) 0.30 1.2 0.20 0.8 0.10 0.4 0.00 0.0 ZFHX4/ACTB (microarray) ZFHX4/ACTB (qRT-PCR) 0.35 1.4 0.30 1.2 0.25 1.0 0.20 0.8 0.15 0.6 0.10 0.4 0.05 0.2 0.00 0.0 MSS BSS PDSS Cell lines