Download
1 / 3
30 likes | 168 Views
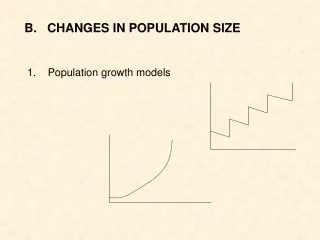
Populations. Population Size Using the data table, create a double bar graph showing alligator births and deaths for four years. Populations. Changes in a Rabbit Population This graph shows how the size of a rabbit population changed over ten years. Populations.

E N D
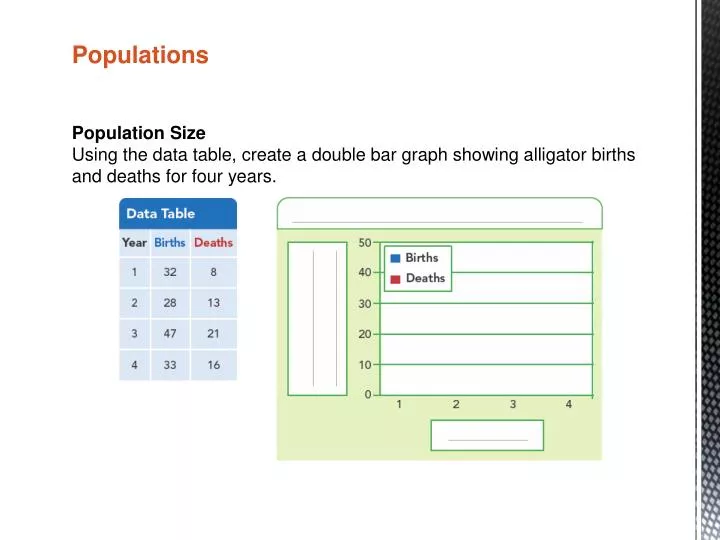
Populations Population Size Using the data table, create a double bar graph showing alligator births and deaths for four years.
Populations Changes in a Rabbit Population This graph shows how the size of a rabbit population changed over ten years.
Populations Population Density of the Flamingos in the Pond In the pond on the top, there are 10 flamingos in 8 square meters. The population density is 1.25 flamingos per square meter.