Download
1 / 42
420 likes | 428 Views
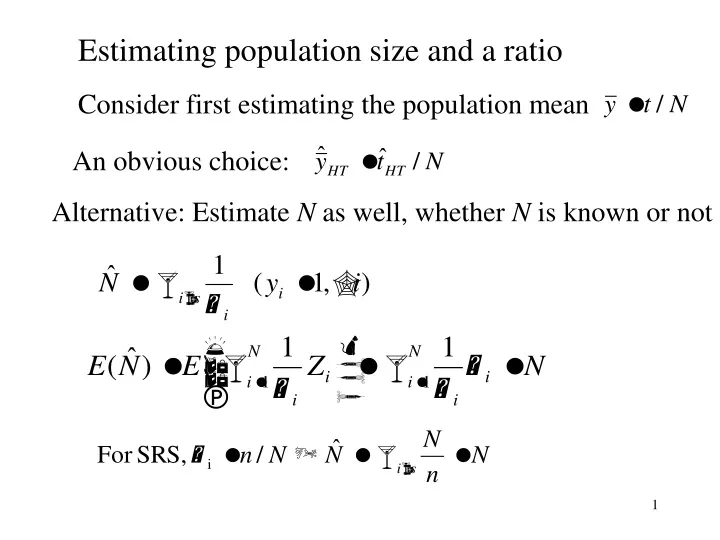
Estimating population size and a ratio. Consider first estimating the population mean. An obvious choice:. Alternative: Estimate N as well, whether N is known or not.

E N D
Estimating population size and a ratio Consider first estimating the population mean An obvious choice: Alternative: Estimate N as well, whether N is known or not
If sample size varies then the “ratio” estimator performs better than the H-T estimator, the ratio is more stable than the numerator Example:
H-T estimator varies because n varies, while the modified H-T is perfectly stable
Review of Advantages of Probability Sampling • Objective basis for inference • Permits unbiased or approximately unbiased estimation • Permits estimation of sampling errors of estimators • Use central limit theorem for confidence interval • Can choose n to reduce SE or CV for estimator
Remaining issues in design-based inference • Estimation for subpopulations, domains • Choice of Survey strategy – • discuss several different sampling designs • appropriate estimators • More on use of auxiliary information to improve estimates • More on variance estimation
Estimation in domains -Let D be the number of domains in the population. We have D subsets, U1,…Ud,…,UD for which estimates are needed. -Let Nd be the size of domain d and nd be the number of sampled units that falls into domain d. Then we have the following partitions of the population and the sample.
Estimation in domains • Ex: Population = all adults aged 16-64 Examples of domains: • Women • Adults aged 35-39 • Men aged 25-29 • Women of a certain ethnic group • Adults living in a certain city The objective is to estimate the domain totals or domain means.
Estimating domain means Simple random sample from the population • e.g., proportion of divorced women with psychiatric problems. Note: nd is a random variable
Can then treat sd as a SRS from Ud • Whatever size of n is, conditional on nd, sdis a SRS from Ud – conditional inference Example: Psychiatric Morbidity Survey 1993 Proportions with psychiatric problems
Estimating domain totals • Nd is known: Use • Nd unknown, must be estimated
Stratified sampling • Basic idea: Partition the population U into H subpopulations, called strata. • Nh = size of stratum h, known • Draw a separate sample from each stratum, sh of size nhfrom stratum h, independently between the strata • In social surveys: Stratify by geographic regions, age groups, gender • Ex –business survey. Canadian survey of employment. Establishments stratified by • Standard Industrial Classification – 16 industry divisions • Size – number of employees, 4 groups, 0-19, 20-49, 50-199, 200+ • Province – 12 provinces Total number of strata: 16x4x12=768
Reasons for stratification • Strata form domains of interest for which separate estimates of given precision is required, e.g. strata = geographical regions • To “spread” the sample over the whole population. Easier to get a representative sample • To get more accurate estimates of population totals, reduce sampling variance • Can use different modes of data collection in different strata, e.g. telephone versus home interviews
Stratified simple random sampling • The most common stratified sampling design • SRS from each stratum • Notation:
th = y-total for stratum h: Consider estimation of th: Assuming no auxiliary information in addition to the “stratifying variables” The stratified estimator of t:
A weighted average of the sample stratum means. • Properties of the stratified estimator follows from properties of SRS estimators. • Notation:
Estimated variance is obtained by estimating the stratum variance with the stratum sample variance Approximate 95% confidence interval if n and N-n are large:
Estimating population proportion in stratified simple random sampling ph: proportion in stratum h with a certain characteristic A p is the population mean: p = t/N Stratum mean estimator: Stratified estimator of the total t = number of units in the with characteristic A:
Allocation of the sample units • Important to determine the sizes of the stratum samples, given the total sample size n and given the strata partitioning • how to allocate the sample units to the different strata • Proportional allocation • A representative sample should mirror the population • Strata proportions: Wh=Nh/N • Strata sample proportions should be the same: nh/n = Wh • Proportional allocation:
The stratified estimator under proportional allocation • Inclusion probabilities: the same for all units in the population, but it is not an SRS The equally weighted sample mean ( sample is self-weighting: Every unit in the sample represents the same number of units in the population , N/n)
Variance and estimated variance under proportional allocation
The estimator in simple random sample: • Under proportional allocation: • but the variances are different:
Total variance = variance within strata + variance between strata Implications: • No matter what the stratification scheme is: Proportional allocation gives more accurate estimates of population total than SRS • Choose strata with little variability, smaller strata variances. Then the strata means will vary more and between variance becomes larger and precision of estimates increases compared to SRS
Constructing stratification and drawing stratified sample in R Use API in California schools as example with schooltype as stratifier. 3 strata: Elementary, middle and high schools. Stratum1: Elementary schools, N1 =4421 Stratum 2: Middle schools, N2 = 1018 Stratum 3: High schools, N3 = 755 5% stratified sample with proportional allocation: n1 = 221 n2 = 51 n3 = 38 n = 310
R-code: making strata >x=apipop$stype # To make a stratified variable from schooltype: >make123 = function(x) +{ + x=as.factor(x) + levels_x = levels(x) +x=as.numeric(x) +attr(x,"levels") = levels_x + x +} > strata=make123(x) > y=apipop$api00 > tapply(y,strata,mean) 1 2 3 672.0627 633.7947 655.7230 # 1=E, 2=H, 3 = M. Will change stratum 2 and 3
> x1=as.numeric(strata<1.5) > x2=as.numeric(strata<2.5)-x1 > x3=as.numeric(strata>2.5) > stratum=x1+2*x3+3*x2 > tapply(y,stratum,mean) 1 2 3 672.0627 655.7230 633.7947 > # stratified random sample with proportional allocation > N1=4421 > N2=1018 > N3=755 > n1=221 > n2=51 > n3=38 > s1=sample(N1,n1) > s2=sample(N2,n2) > s3=sample(N3,n3)
> y1=y[stratum==1] > y2=y[stratum==2] > y3=y[stratum==3] > y1s=y1[s1] > y2s=y2[s2] > y3s=y3[s3] > t_hat1=N1*mean(y1[s1]) > t_hat2=N2*mean(y2[s2]) > t_hat3=N3*mean(y3[s3]) > t_hat=t_hat1+t_hat2+t_hat3 > muhat=t_hat/6194 > muhat [1] 661.8897 > mean(y1s) [1] 671.1493 > mean(y2s) [1] 652.6078 > mean(y3s) [1] 620.1842
> varest1=N1^2*var(y1s)*(N1-n1)/(N1*n1) > varest2=N2^2*var(y2s)*(N2-n2)/(N2*n2) > varest3=N3^2*var(y3s)*(N3-n3)/(N3*n3) > se=sqrt(varest1+varest2+varest3) > se [1] 44915.56 > semean=se/6194 > semean [1] 7.251463 > CI=muhat+qnorm(c(0.025,0.975))*semean > CI [1] 647.6771 676.1023 #CI = (647.7, 676.1)
Suppose we regard the sample as a SRS > z=c(y1s,y2s,y3s) > mean(z) [1] 661.8516 > var(z) [1] 17345.13 > sesrs=sqrt(var(z)*(6194-310)/(6194*310)) > sesrs [1] 7.290523 Compared to 7.25 for the stratified SE. Note: the estimate is the same, 661.9, since we have proportional allocation
Optimal allocation If the only concern is to estimate the population total t: • Choose nh such that the variance of the stratified estimator is minimum • Solution depends on the unkown stratum variances • If the stratum variances are approximately equal, proportional allocation minimizes the variance of the stratified estimator
Called Neyman allocation (Neyman, 1934) • Should sample heavily in strata if • The stratum accounts for a large part of the population • The stratum variance is large • If the stratum variances are equal, this is proportional allocation • Problem, of course: Stratum variances are unknown • Take a small preliminary sample (pilot) • The variance of the stratified estimator is not very sensitive to deviations from the optimal allocation. Need just rough approximations of the stratum variances
Optimal allocation when considering the cost of a survey • C represents the total cost of the survey, fixed – our budget • c0 : overhead cost, like maintaining an office • ch: cost of taking an observation in stratum h • Home interviews: traveling cost +interview • Telephone or postal surveys: ch is the same for all strata • In some strata: telephone, in others home interviews • Minimize the variance of the stratified estimator for a given total cost C
In particular, if ch = c for all h: We can express the optimal sample sizes in relation to n
Other issues with optimal allocation • Many survey variables • Each variable leads to a different optimal solution • Choose one or two key variables • Use proportional allocation as a compromise • If nh > Nh, let nh =Nh and use optimal allocation for the remaining strata • If nh=1, can not estimate variance. Force nh =2 or collapse strata for variance estimation • Number of strata: For a given n often best to increase number of strata as much as possible. Depends on available information
Sometimes the main interest is in precision of the estimates for stratum totals and less interest in the precision of the estimate for the population total • Need to decide nhto achieve desired accuracy for estimate of th, discussed earlier • If we decide to do proportional allocation, it can mean in small strata (small Nh) the sample size nh must be increased
Poststratification • Stratification reduces the uncertainty of the estimator compared to SRS • In many cases one wants to stratify according to variables that are not known or used in sampling • Can then stratify after the data have been collected • Hence, the term poststratification • The estimator is then the usual stratified estimator according to the poststratification • If we take a SRS and N-n and n are large, the estimator behaves like the stratified estimator with proportional allocation
Poststratification to reduce nonresponse bias • Poststratification is mostly used to correct for nonresponse • Choose strata with different response rates • Poststratification amounts to assuming that the response sample in poststratum h is representative for the nonresponse group in the sample from poststratum h