Download
1 / 142
1.52k likes | 1.97k Views
Operational Risk Training Managing Operational Risk & AMA Toronto Nov 3, 2011. Bogie Ozdemir & Evren Cubukgil. Agenda - Morning. Agenda - Afternoon. Principles of an Effective Operational Risk Framework.

E N D
Operational Risk Training Managing Operational Risk & AMA TorontoNov 3, 2011 Bogie Ozdemir & Evren Cubukgil
Principles of an Effective Operational Risk Framework • Actionable – facilitate effective operational risk and capital management –Models don’t manage Op Risk, people do • Facilitate Institutional Learning – We need to connect the dots • Reliable, Consistent, Stable across time and the organization – Relative accuracy is a key • Defendable • Quantifiable –We cannot manage it if we cannot quantify it • Complementary, marry Expert Judgment and Analytics - Use all Available Information
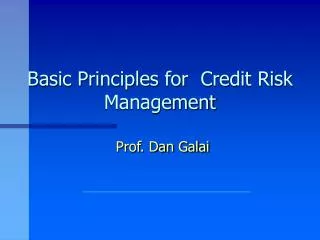
Earlier Practices and Lessons Learned • SCORE-CARD LIKE APPROACHES • A score is assigned to Each Risk Type based on subjective criteria (perceived risk, effectiveness of controls, audit findings, etc). Aggregated to arrive at an overall score using weights/multipliers. Top-down capital numbers are assigned • An attempt to make use of expert judgment, provide some incentive to manage risk, but • Subjective, Simplistic and not defendable Low Risk High Risk Medium Risk
Earlier Practices and Lessons Learned • SINGLE EQUIVALENT SCENARIO QUANTIFICATION • Can have different starting points; • Single overall event based scenario can directly be quantified as Capital or • Event based scenario per risk type can be aggregated as Capital • Discussion can be very useful to surface potential risks but • No complete Op VaR distribution, thus • No way of knowing if the scenario corresponds to a capital event at the required confidence level • In a workshop a tail scenario is identified, discussed and quantified. The result is used as Capital
Earlier Practices and Lessons Learned Earlier OpVaR approaches A complete Op VaR distribution but, In the absence of a reliable supporting governance, validation framework, consistency and defendability are not achieved. Workshops turned into a negotiation process, The approached quickly lost credibility and faded! Overreliance on the quantitative approach was clearly not the solution • Quantitatively similar to today’s AMA, it uses frequency (typically Poisson) and severity (typically log-normal) distributions to obtain an OpVaR distribution. While internal data are used for high frequency - low severity events covering the body of the distribution, workshops are used for the low frequency – high severity events constructing the tail
2 Risk Categories and Nature of Loss Management Action: It allows the LOBs to manage their operational Capital at Risk and make cost/benefit decisions on controls and insurance. 3 1 Back to the FutureI- Capital Estimation Process - Example RISK ASSESSMENT FRAMEWORK (Parameter Estimation Qualitative+Quantitative) OUTPUT INPUTS For Frequency: Expert Opinion, IT, etc. Audit Reports Management Interviews Management Reports Loss History External Reports For Severity: Management Interviews Loss History - Internal - External MODELING Methodology Inputs “Monte Carlo Simulations” REVIEW AND VALIDATION FEEDBACK OPERATING RISK REVIEW COMMITTEE
Back to the FutureII-Modeling Approach Methodology Inputs: • The identification of the risk types found in the line of business through the assessment process facilitated by the Operational Risk unit of RMG • The average frequency of the operational loss events by risk type: Expected # of occurrences per year • = 100 (100 events per year) • = 0.2 (1 event in every 5 years) • The average severity of the operational loss events by risk component: Expected $ loss per event • = $100,000 ($100,000per event) The assessment process uses loss events from historical data, industry data, management interviews, Audit reports, etc.
Back to the FutureMethodology Assumptions Frequency Distribution = Poisson Distribution Why Poisson: • One parameter distribution, easy to calibrate • Widely used in insurance industry for event risk modeling Severity Distribution = Lognormal Distribution Why Lognormal: • Practical: Similar to normal, but can not have negative values (losses) Not possible to validate these assumptions using historical data, but they are reasonable and provide the simplest model based solution
Risk Classes Scenarios Back to the FutureMonte Carlo Simulation EC • For each scenario, • # of events per risk class over next year is simulated • $ loss per event per risk class is simulated • the $ losses are aggregated per risk class • cumulative losses for all risk classes are aggregated • Repeat the same procedure 10,000 times • Then the worst possible operational loss at the required confidence level is used for Capital Estimation
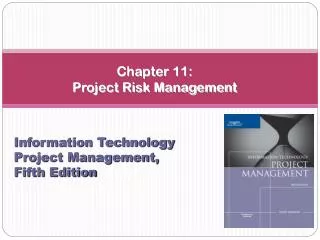
Back to the FutureLoss Distribution Confidence Level 99.95% High Frequency, Low Severity Low Frequency, High Severity Capital
Expected Losses: Mean events High Frequency, Low Severity (Processing Errors, Fraud, etc.) Think of internal controls as a filter Residual risk is the risk after the filter, contributing towards EL’s Capital: Tail events Low Frequency, High Severity (Legal Risk, Image and Reputational, etc.) Think of internal controls as a filter Catastrophic losses if the filter itself breaks down Inherent Risk Back to the FutureLoss Distribution
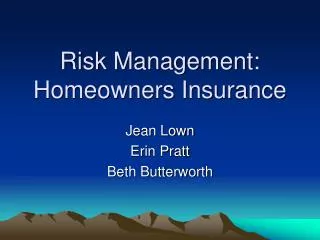
The Basel Committee definition “The risk of loss resulting from inadequate or failed internal processes, people and systems or from external events.” Lack of loss data makes it impossible to rely solely on quantitative models for Operational Risk Economic Capital Financial industry has developed various qualitative models for assessing Operational Risk Leading Market practice incorporates available loss data with qualitative methods within a robust conceptual framework.
Qualitative Practices For Capturing OpRisk Although Forward looking, capital numbers are directly calibrated based on qualitative assessments. Results are difficult to challenge – Lack of discipline in managing risk Risk Control and Self Assessment (RCSA) process Businesses qualitatively assess their internal controls and inherent risk factors. Monitor Key Risk Indicators for Businesses. Scenario Analysis Working together, Business and OpRisk experts formulate a set of worst case scenarios meant to capture extreme tail risk loss events
Quantitative Practices for Capturing OpRisk Historical loss data is not forward looking, and is not sensitive to changes in current risk factors – little incentive to manage risk Using Internal Loss Data to directly calibrate a loss distribution to infer a capital number Lack of internal loss data - will never observe tail loss events Use External Data to calibrate a loss distribution and infer a capital number Much more data available Risk profiles can be mismatched between internal business units and industry loss experience
AMA Provides a Formalized Framework to Consistently Manage Operational Risk
Basel II & Solvency II - what lies aheadEvren • AMA has emerged as industry best practice from the requirements set out in Basel II for the measurement and management of operational risk. • Regulatory requirements are broadly defined, so as to allow institutions to tailor approaches to organizational needs • Well documented approach for weighting the use of BEICF, Scenario Analysis, Internal and External Data in measuring Economic Capital. • Banking regulators are familiar with AMA given long history of implementation and approval (BIS June 2011 supervisory guidelines) • Regulatory requirements for operational risk management for insurance companies have lagged those applying to banks • Under Solvency II insurance companies are required to demonstrate that their methodology for quantifying operational risk is aligned with their risk profile, and that the output from that methodology is used in strategic decision making and business planning (Use Test). Standardized or formula based approaches will generally fail the Use Test. • Following Solvency II and the higher standards for operational risk in the banking sector, regulators in North America will require a move towards best practices by insurance companies.
Basel Operational Risk Event Types Internal fraud: intentional misreporting of positions, employee theft and insider trading on an employee’s own account. External fraud: robbery, forgery, check kiting and damage from computer hacking. Employment practices and workplace safety: compensation claims, violation of employee health and safety rules, organized labor activities, discrimination claims and general liability (for example, a customer slipping and falling at a branch office). Clients, products and business practices: fiduciary breaches, misuse of confidential customer information, improper trading activities on the bank’s account, money laundering and sale of unauthorized products. Damage to physical assets: terrorism, vandalism, earthquakes, fires and floods. Business disruption and system failures: hardware and software failures, telecommunication problems and utility outages. Execution, delivery and process management: data entry errors, collateral management failures, incomplete legal documentation, unapproved access given to client accounts, non-client counterparty miss-performance and vendor disputes.
Examples in the Insurance Industry Internal Fraud External Fraud Employment Practices and Workplace Safety Client, Products and Business Processes Damage to Physical Assets Business Disruption and Systems Failures Execution, Delivery and Process Management Employee theft, claim falsification Claims fraud, falsifying application information Repetitive stress, discrimination Client privacy, bad faith, red-lining Physical damage to own office or vehicle fleets Processing center downtime, system interruptions Policy Processing, claim payment errors Examples in Insurance Basel Event Types
AMA and the Use Test 4 broad principles that institutions have to consider at a minimum to satisfy the Use Test provided by the EBA: • The purpose and use of the AMA should not be limited to regulatory purposes • The framework is used to manage operational risk exposures across different business lines • How inputs, estimations, predictions or outputs from the risk measurement system are used in the decision making process (strategic or tactical decision making • The AMA should evolve as the institution gains experience with risk management techniques and solutions • How the institution ensures that the nature and balance of inputs into the framework are relevant and fully reflect the nature of the business • How the framework becomes more responsive and robust over time
AMA and the Use Test • The AMA should support and enhance the management of operational risk within the organization • How decisions for improving processes and controls are made • Operational management objectives and activities are communicated within the organization • The use of an AMA should provide benefits to the organization in the management and control of operational risk. • Senior management has considered action on its receipt of information from the framework • AMA increases transparency, risk awareness and operation risk management expertise, and creates incentives to improve the management of operational risk throughout the organization.
Designing a Comprehensive AMA Framework • Advanced Measurement Approach (AMA) has emerged as the best practice already used by Basel II banks and being implemented by Solvency II adopting insurers • AMA was originally based on an actuarial approach to modeling claim severity and frequency. Its earlier – pre Basel II implementation has not been successful due to sole reliance on quantitative models in a data starved field without the supporting governance and control infrastructure. • Under Basel II, AMA has matured with the supporting governance and control infrastructure being mandatory components. With these components in place, AMA provides Financial Institutions with a useful framework to quantify and manage the Op Risk with actionable cost vs benefit decision capability. • AMA is not a quantitative model, but a process and framework, which encompasses both quantitative and qualitative elements within a controlled environment.
AMA Framework Brings 4 Approaches Together None of the aforementioned approaches (RCSA, Scenario Analysis, Internal and External data) can be satisfactorily used on its own to manage Operational Risk AMA provides a framework in which each of the approaches can be brought together; results of each approach can be validated against each other Qualitative assessments (Scenarios and RCSA) bring a forward looking perspective of the risk profile to empirical loss experience Capital models and empirical loss data ground qualitative assessments in industry experience. Common Language within AMA Framework is Frequency and Severity
Internal Loss Data Establish an internal loss database to consistently record loss events in Business-Unit / Even-Type categories – Mapping and Aggregation matters External Loss Data Must be purchased from an external consortium (if necessary mapped to internal loss categories) Risk Control and Self Assessment (RCSA) Operational risk management indicators that provide forward-looking assessments of business risk factors as well as internal control environment. Assessment of expected (mean) impact of risk types on Business Units Score Risk types according to severity and frequency within Business Units Loss Scenarios Hypothetical loss scenarios defined over a severity range and according to frequency / likelihood of occurring (ex. 1 event every 5 years). Assessment of extreme tail events of risk types on Business Units Developed through formalized and replicable workshops with full representation from business units. Using All Available Information
Designing a Comprehensive AMA Framework Necessary components and their inter-connectivity Internal Data Frequency and Severity Enterprise Consistency Check Curve Fitting per Risk Type Aggregation Op VaR Scaling Validation Scenario Analysis External Data Consortium External Data Public RCSA Risk Identification & Quantification Risk Management
Internal Data • Internal data Issues: • EL type losses, certainly not tail • Availability (3 years are required under Basel, but no magic number) How many years of history do we need? • Retroactive data collection • Truncated loss collection (Basel limits: collection over $10K) – collection cost vs accuracy • Changing the culture (Admitting to the op risk event) • Near misses are harder to capture – how to quantify? • Capturing the losses which unfold over a long period of time: time of occurrence, continuous updates • Discounting the losses to estimate the severity - discount rate?
Designing an Internal Loss Database • Database has to be designed to roll up into Business Unit – Event Types (Units of Measure) for which capital will be calculated in the Framework • Highest level of event types must correspond to Basel categories for compatibility with external data sources, and participation in consortiums • Sub categories can vary across business groups depending on the nature of the risk profile • Sub-Categories to be defined in conjunction with business groups based on common underlying causes of loss events • How Granular to go? Implications for Modeling • Executive Fraud vs Teller Fraud, should they be treated as different loss categories, or just different degrees of the same loss type? • If they are different, how to allocate intermediate event types (middle management fraud) • Additional levels of granularity benefit RCSA and Scenario Analysis workshops by allowing more detailed analysis of internal data. • The more granular the loss categories the more diluted the data available for analysis within each category.
Within the AMA framework Capital will be calculated and held at the level of Units of Measure (Business Unit – Event Type Categoreis) Units of Measure
Shared Service Centers • How to address risks of shared internal service centers within the database and in the broader framework • Businesses will resist recognizing losses incurred by processes which they do not manage directly, or are shared across the enterprise • Categorization has to link to capital allocation, if the service center cannot hold capital, risks have to be allocated to business units using the service center, in the same way as risks incurred by outsourced services • Loss exposure of business units to shared service centers has to be managed carefully to avoid double counting across the enterprise • Joint exposure to shared services has to be recognized in modeling correlations between units of measure
Recording Operational Losses • ORX data standards: • An Operational Risk event is an event leading to the actual outcome(s) of a business process to differ from the expected outcome(s), due to inadequate or failed processes, people and systems, or due to external facts or circumstances. • Includes Legal Risk: • Legal Risk is the risk of being sued or being the subject of a claim or proceedings due to non-compliance with legal or statutory responsibilities and/or losses due to inaccurately drafted contracts. This includes the exposure to new laws as well as changes in interpretations of existing law by appropriate authorities and exceeding authority as contained in the contract. This applies to the full scope of Group activities and may also include others acting on behalf of the Group. Legal Risk is a component of Operational Risk. • Basel II requirements: • Legal Risk includes, but is not limited to fines, penalties, or punitive damages from supervisory actions, or to judgments or private settlements (Basel II Accord section V. A. §644 - Definition of Operational Risk) or to the reduction in asset values or cashflows.
Anatomy of an Operational Loss • Dates Define a Loss Event • 1 Date of Occurrence: the date when the event happened or first began, • 2 Date of Discovery: the date on which the firm became aware of event, and • 3 Date of Recognition / Accounting Date: the date when a loss or reserve/provision was first recognized in the P&L • Date of Resolution – (Duration of loss event) • This is a standard requirement for recording losses in industry consortiums • Standard practice is to leave loss dates unchanged, even if further losses are realized over time. If multiple losses are posted at different times in the General Ledger, losses linked to original dates should be updated (Grouped Losses).
Truncation of Recorded Loss Events • Loss event databases will typically not record all loss events • As losses become smaller and smaller there is a point at which the benefit of having the loss available in an AMA framework is outweighed by the effort / cost of recording it. • Small losses are not very informative of exposure to significant operational loss events (High Severity Low Frequency) • Impact on modeling likelihood of large losses: • 10 small losses and 10 medium – large losses • 95th percentile becomes the 90th percentile
Conditional Probability • Probability that a loss L is less than a, based on a data set where only losses greater than b are reported. • Based on the definition of conditional probability, we only need to adjust the likelihood function when estimating the probability density function of the severity distribution. If we don’t we’d be overstating the severity.
How to Record & Use Near Miss Losses • Stands between actual loss and hypothetical loss (scenario?) • Were losses averted by chance, or were losses averted due to controls? • Is there a difference? • Separate categorization in loss database • How to incorporate into modeling? • Cannot augment realized loss data with near miss events • Need to assess probability of near miss loss occurrence, because it didn’t actually happen: 1 near miss event in 10 years is not a 1 in 10 year event; how many 10 year periods would we have to experience before the near miss event was actually realized? • Incorporate into modeling with hypothetical loss scenarios.
Grouped losses • Some operational losses can be characterized by multiple losses over several years. • Several losses occur before their cause is identified and remediated • Regulatory fines, or legal settlements are linked to operational failures in the past • All losses should be tied to their underlying causal event. This could require previous loss event data points to be updated over time, and calls for careful management of the internal loss event databases. • ORX Requirements: • An event may have multiple associated losses. In such cases, an investigation may be necessary to identify the “root event”—that is, the initial event without which none of the related losses would have occurred. For ORX purposes, the root event is included in a single record, containing all related losses, and is classified according to its specific event characteristics.
Discounting Grouped Loss Events to the Date of the Causal Event • Grouped loss events reported to ORX are not discounted, due to complexity and availability of information: • Which discount rate to use? • Risk free discount rate – at the time of the original event? – at the time of the newly reported event? • Should one use risk adjusted discount factors? Required rate of return / cost of capital? • What is the impact on modeling of not discounting grouped losses realized over extended time periods?
Discounting Grouped Loss Events to the Date of the Causal Event - Ctd • Risk adjusted discount rate: • Who’s perspective is the operational loss from? Debtholders, Policyholders? Deposit Holders? Shareholders? • Magnitude of EC is assessed from the debtholder or policyholder perspective, return on EC is assessed from the shareholder’s perspective. • Operational losses experienced are distinct from Economic Capital held against operational risk, and on which firms must earn a required rate of return for shareholders – this is not the relevant discount rate to apply to grouped losses. • Shareholder’s required rate of return would take into account all un-diversifiable risk in returns generated by the financial institution: including market, credit, operational, etc. (weighted average cost of capital) • Conceptually, Operational loss events likely have low levels of un-diversifiable / systematic risk
Discounting Grouped Loss Events to the Date of the Causal Event - Ctd • There are difficulties in obtaining data for estimating time series correlation of loss severity between observed operational loss events and other risk types and returns. • When losses take place over several years, the time horizon is uncertain, and in some cases independent of loss severity (regulatory fines, lawsuits) • Applying risk adjusted discount factors to operational losses which take place over multiple years would result in less conservative estimates of losses. • Given uncertainty over methodology it’s always better to be conservative. • If operational losses have little or no systematic or un-diversifiable risk, they should be discounted over multiple years based on the risk free interest rate. • The relevant discount rate is not that prevailing at the time of the initial causal event, nor the rate prevailing at the time the loss impacts a firm’s P&L • The relevant rate is that prevailing at the time of modeling the capital, as this is the perspective from which the potential loss is being assessed.
Internal Data and Expected Loss • Given a sufficiently fat tailed distribution, Internal loss data is only informative of the body of the loss distribution – mean loss events • Conceivably many thousands of loss data points may be required in order to sample from the tail of the loss distribution of an individual business unit event type • Fitting a severity distribution to internal loss data can be miss-leading if we only have points around the body of the distribution, and have not observed any tail loss events. • Lack of tail observations may lead to the selection of an inappropriate probability density function used to approximate the severity distribution. Capital figures can vary substantially based on the choice of severity distribution • For a given density function used to approximate the severity distribution of losses, fitted parameter values may be inappropriate given the lack of tail data.
Collecting Internal Data – How Many Years are Needed? • Generally regulators expect a minimum of 3 years of internal loss data. • European banking authority requires 3 years of internal loss data when institutions initially apply for AMA, and mandates the use of minimum of 5 years of internal loss data as it is acquired. • There is no set minimum amount of data that will ensure more accurate results of the model, or superior management of risk in the framework • Lower the event frequency the more years of data • Depending on how quickly an institution grows or undergoes internal changes, data can quickly become stale. • You can’t drive a car by looking the rear view mirror
Retroactively Collecting Data • Retroactively collecting losses can skew the perspective of the risk profile: • When collecting historical losses it is uncertain what percentage of losses can be recovered in given years • The threshold above which losses are recovered is not fixed and is unknown: may only find 30% of losses between $100k and $500k, and 50% of losses between $50k and $100k. • When retroactively collecting losses a sufficiently high threshold must be set so as to ensure that all relevant losses are collected: Retroactively record all losses above $20 m, $100 m. • Similar to hypothetical loss events or near miss events, retroactively collected internal losses cannot be added directly to the internal loss event database. • Retroactively collected loss events can be useful in validating loss distributions (back-testing the largest loss in 10 years)
Setting the Tone at the Top • Populating the internal loss event database requires strong support from senior executives and the board. • Business Units may not want to appear to have higher or more frequent operational losses, and may resist reporting initiatives • Negative equilibrium: there is no incentive to be the first business unit to buy into recording operational losses • Neglecting to record minor loss events places upward bias on the likelihood of larger loss events that are recorded. – Businesses can benefit by being more diligent about recording lower operational losses. • Incentivize businesses within the framework: RCSA must be supported by internal data. Incentivize progress: • At first RCSA is supported or validated by collection efforts. • As process matures and data is collected, RCSA becomes supported by results of data collection.
External Data • External data • Consortium (ORX, ORIC) • Public (First, SAS) • Private / Proprietary (Aon OpBase) • How do we use it? • Scaling • In direct calibration • In stimulating RCSA and Scenario analysis • In Validation • Complementary: external data Covering different regions of the distribution
External Data Sources: • SAS OpRisk Global Data: • largest database of losses over $US 100k: 25 000 loss events. • Losses are categorized according to Basel II event types, and by individual business lines • Facilitates data scaling according to firm size by revenue, assets, net income, number of employees and shareholder equity • Database is populated by commercial online information providers and thousands of publications • Aon OpBase: • quantitative and qualitative information on more than 16,500 losses and incidents experienced by more than 1,600 financial institutions worldwide • Based on both proprietary (through reinsurance brokerage business) and publicly available data • Loss amounts range from $US 4 to $US 798m.
External Data Sources: • ALGO – FIRST: • Leading database for scenario analysis • Contains approximately 10 000 events • Collected from publicly available sources • Includes detailed qualitative analysis of each event based on control breakdowns and event triggers • Losses categories span corporate governance, strategic issues, market practices, and business risk • ORX • Leading consortium database for banks • 212 282 operational loss events recorded from 57 member firms • Insurance database is in development with an initial planned number of 8 participating firms • Losses colected since 2002
External Data Sources: • ORIC • Maintained by the Association of British Insurers (ABI) • Leading operational loss data consortium for insurance companies • Includes over 3000 loss events collected over the last 5 years • 3 levels of loss categorization with level 1 losses consistent with Basel II • 26 members, European insurance firms