Download
1 / 26
280 likes | 435 Views
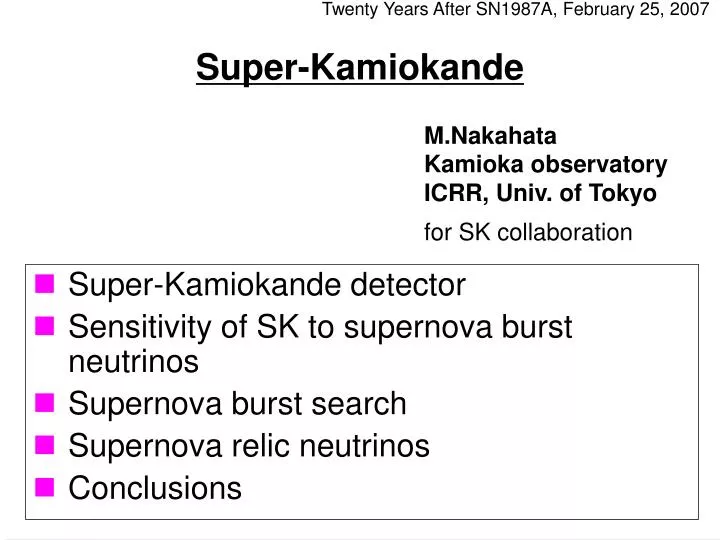
Twenty Years After SN1987A, February 25, 2007. M.Nakahata. Kamioka observatory ICRR, Univ. of Tokyo. Super-Kamiokande. for SK collaboration. Super-Kamiokande detector Sensitivity of SK to supernova burst neutrinos Supernova burst search Supernova relic neutrinos Conclusions.

E N D
Twenty Years After SN1987A, February 25, 2007 M.Nakahata Kamioka observatory ICRR, Univ. of Tokyo Super-Kamiokande for SK collaboration Super-Kamiokande detector Sensitivity of SK to supernova burst neutrinos Supernova burst search Supernova relic neutrinos Conclusions
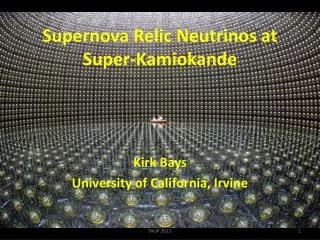
Super-Kamiokande Detector SK-I Number of ID PMTs (photocoverage) Start 50kton water Cherenkov detector with 32kton photosensitive volume 1000m underground 11,146 (40%) SK-I Accident SK-II SK-III Partial Reconstruction 5,182 (19%) SK-II Full reconstruction 11,129 (40%) SK-III (Number of OD PMT: 1885)
~6000 20-inch PMTs were produced from 2002 to 2005 and were mounted from Oct.2005 to Apr.2006. All those PMTs were packed in acryic and FRP cases. Full Reconstruction (October 2005 – April 2006) Mount PMTs on a floating floor. Pure water was supplied and SK-III data taking has been running since July 11, 2006.
Expected number of events from a supernova at SK ~7,300 ne+p events ~300 n+e events ~100 ne+16O events for 10 kpc supernova (-) Neutrino flux and energy spectrum from Livermore simulation (T.Totani, K.Sato, H.E.Dalhed and J.R.Wilson, ApJ.496,216(1998)) 5MeV threshold
Expected time profile and spectrum SN at 10kpc Expected number of events in parentheses Visible energy spectrum Time profile Neutrino flux and spectrum from Livermore simulation Neutrino oscillations are not taken into account here.
Effect of neutrino oscillations νe+p→e++n SN at 10kpc Time profile Neutrino flux and spectrum from Livermore simulation ν+e-→ν+e- Dot: Inverted hierarchy (PH=0) Dash: Nomal, Inv.(PH=1) Solid: No oscillation PH: crossing probability at H resonance (PH=0: adiabatic) Neutrino oscillation increase number of events by 10~30 %.
Neutronization burst Event rate of ne+p events nep events during this 10msec is about 5 - 20 events (e-+pn+ne) Number of events from 20msec to 0.1 sec SN at 10kpc Neutrino flux and spectrum from Livermore simulation Event rate of neutronization burst (forward peaked n+e scattering events) No oscillation Normal PH=1 or Inverted hierarchy Normal hierarchy PH=0 PH: crossing probability at H resonance (PH=0: adiabatic) Number of events from neutronization burst is 0.7~5 event for SN@10kpc.
neenergy spectrum and time variation of energy Neutrino flux and spectrum from Livermore simulation SN at 10kpc Visible energy spectrum in each time range range 20 time bins Time variation of average energy < 0.1sec 0.1 - 1sec 1 - 18sec
Model dependence of luminosity and energy Burst models Totani, Sato, Dalhed and Wilson, ApJ.496,216(1998) Thompson, Burrows and Pinto, ApJ.592, 434(2003) Buras, Janka, Rampp and Kifonidis, A&A 457, 281(2006) (s112_128_f). Sumiyoshi, Yamada, Suzuki, Shen, Chiba and Toki, ApJ.629, 922(2005) Shen EOS Liebendorfer, Rampp, Janka, and Mezzacappa, ApJ. 620, 840(2005) AGILE-BOLTZTRAN Liebendorfer, Rampp, Janka, and Mezzacappa, ApJ. 620, 840(2005) VERTEX Thanks to H.Suzuki for compiling the model.
Sensitivity of SK for time variation measurement Assuming a supernova at 10kpc, expected statistical error is plotted. Time variation of event rate Time variation of mean energy Enough statistics to test those models
Identification of ne scattering events by direction to supernova ne+p ne+p ne+p ne+p n+e SN at 10kpc n+e Direction of supernova can be determined with an accuracy of 2-3 degrees. ne scattering events can be statistically extracted using the direction to supernova. n+e n+e Neutrino flux and spectrum from Livermore simulation
ne+nx spectrum measurement by ne scattering SN at 10kpc SN at 2kpc Spectrum measurement up to ~20MeV. Spectrum measurement up to ~50MeV. Neutrino flux and spectrum from Livermore simulation
Performance of Data Acquisition System Pulse generator 10sec 12kHz x 1s Events/10msec ~7kHz x 2s A LED with a diffuser ball ~2kHz x 7s T(sec) The SK electronics was designed to be essentially “dead time free”: • Each channel (i.e. PMT) has individual discriminator and two sets of analog buffers for storing timing(T) and charge(Q) information before digitization. Soon after one set is occupied, another set is enabled. • Global trigger (PMT multiplicity > N) is always enabled. Exceptions are : • 800nsec veto after each trigger to avoid extra trigger by signal reflection. • Wait digitization of T and Q analog data when number of events in front end electronics reach 64 events. The performance of the DAQ system was checked using a LED pulse source. LED light source LED pulse timing pattern This is an example of 40,000 event burst. (corresponds to ~5kpc supernova.) The light intensity is equivalent to ~25 MeV event.
Results of DAQ performance test 10sec #ev/1ms ~5kpc time(sec) #ev/1ms ~4kpc time(sec) ~3kpc #ev/1ms ~2kpc time(sec) No dead time upto 60k events (~4kpc supernova.) There is some dead time for high rate cases. But, DAQ system does not crush. SN distance The SK electronics and DAQ system will be replaced in summer 2008. In the new system, ALL PMT hits (including PMT dark noise) will be collected.
On-line supernova alarm system Data Acquisition system Online host computer A few minutes later Supernova watch computer Offline computer can process within 5 min. (for 10kpc supernova) If a candidate is found • Selection criteria: • ≥ 25 ev. in inner 22.5kton volume within 20 sec. • Rmean > 7.5m ALARM Notify to shift person and supernova experts Rmean: averaged distance between event vertices. This cut rejects spallation and flasher backgrounds. Send signal to SNEWS Check vertex distribution and event pattern SNEWS: (SuperNova Early Warning System) Alarm rate was about once per ~10 days. (specification of SNEWS).
Accuracy of absolute time South/North West/East Optical fiber link to SK GPS antennas at the entrance Tracking of GPS satellite 24 hours Absolute time accuracy is better than 100nsec. (confirmed by bunch structure of K2K events.) Green curve: tracked satellite
Off-line supernova search(1) M.Ikeda’s poster for the details of off-line search.. Data sample: Essentially same sample as solar neutrino analysis but some cuts on run and event selection are relaxed. Supernova simulation Rmean used in the further cut Multiplicity: 3, 4, 8 Averaged distance between vertices Clusters cut Rmean [m] Spallation and flasher event clusters give small Rmean.
Off-line supernova search(1) cut They happened during mine blasting, i.e. due to flashing PMTs. Two clusters due to spallation+accidental events. No supernova candidate during SK-I and SK-II.
Off-line supernova search (2) Search with Lower multiplicity threshold • Criteria • Multiplicity ≥ 2 events • Time window = 20 sec. • Energy > 17 MeV • (the energy threshold was optimized by the number of background and efficiency) cut They happened during mine blasting, i.e. due to flashing PMTs. (same as previous page) No candidate even in this method during SK-I and SK-II.
Detection efficiency vs. distance Lower multiplicity search (N≥ 2events, E>17MeV, DT=20sec) Standard cut ≥ 3 events / 0.5 sec ≥ 4 events / 2 sec ≥ 8 events / 10 sec LMC Detection efficiency Andromeda @ 700 kpc Distance [kpc] No candidate Galactic SN rate < 0.32 SN/year (90% C.L.) ( < 0.2 SN/year combined with Kamiokande)
Search for supernova relic neutrinos Reactor n Solar 8B Solar hep SRN predictions Atmospheric n Population synthesis (Totani et al., 1996) Constant SN rate (Totani et al., 1996) Cosmic gas infall (Malaney, 1997) Cosmic chemical evolution (Hartmann et al., 1997) Heavy metal abundance (Kaplinghat et al., 2000) LMA noscillation (Ando et al., 2002) Spallation B.G. below ~15 MeV
Energy spectrum of SK-I and SK-II (>18MeV) SK-I (1496days) SK-II(791 days) 90% CL limit of SRN Total background Atmospheric nm → invisible m → decay e Atmospheric nm → invisible m → decay e Events/4MeV Energy (MeV) Atmospheric ne Atmospheric ne Remaining spallation T.Iida’s poster for the details. Observed spectrum is consistent with estimated background.
Flux limit and theoretical prediction n Ee>18 MeV (En>19.3 MeV) SK-II upper limit: < 3.7 /cm2/sec (preliminary) SK limit (90% C.L.) SK-I upper limit: < 1.2 /cm2/sec Flux revise in NNN05 SK limit is close to the expectation !
ne can be identified by delayed coincidence. Possible improvement in future Neutron tagging Possibility 1 n+p→d + g n g ne 2.2MeV g-ray p p DT = ~ 200 msec Number of hit PMT is about 6 in SK-III Gd e+ g Possibility 2 n+Gd →~8MeV g DT = ~30 msec Positron and gamma ray vertices are within ~50cm. Add 0.2% GdCl3 in water ( M.Vagins’ talk)
Possibility of SRN detection Relic model: S.Ando, K.Sato, and T.Totani, Astropart.Phys.18, 307(2003) with flux revise in NNN05. If invisible muon background can be reduced by neutron tagging SK10 years (e=80%) Assuming 90% of invisible muon B.G. can be reduced by neutron tagging. Assuming 80% detection efficiency. Signal: 22.7, B.G. 13.1 (Evis =15-30 MeV) Signal: 44.8, B.G. 14.7 (Evis =10-30 MeV)
Conclusions • High statistics supernova signal is expected for galactic supernova. It enables us to measure • Precise ne spectrum and time profile • ne + nx(m,t) spectrum measurement by ne scattering • No galactic supernova was observed during SK-I and SK-II. Supernova rate limit is < 0.32 SN/year (90% CL) • SRN flux limit of SK-I is close to theoretical predictions. Future improvement by neutron tagging should enable us to detect SRN signals.