Download
1 / 44
450 likes | 635 Views
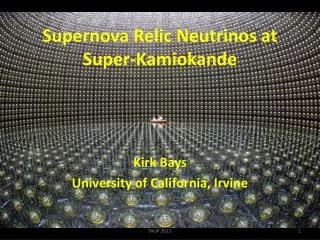
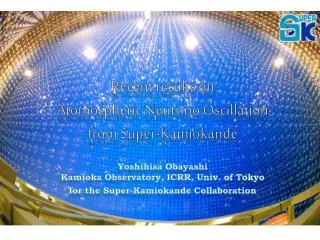
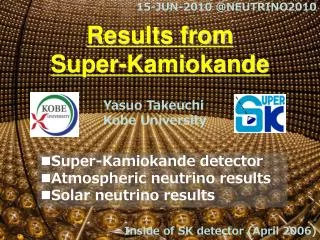
SN Physics Workshop September 17 th 2009. Super-Kamiokande Results. Michael Smy UC Irvine. Super-Kamiokande. 50,000 tons of ultra-pure Water 11,129 20” PMTs covering 40% of the inner 32,000 tons: ~six photo-electrons per MeV

E N D
SN Physics Workshop September 17th 2009 Super-Kamiokande Results Michael Smy UC Irvine
Super-Kamiokande • 50,000 tons of ultra-pure Water • 11,129 20” PMTs covering 40% of the inner 32,000 tons: ~six photo-electrons per MeV • 1,885 8” PMTs with wavelength shifter plates view the outer 18,000 tons Michael Smy, UC Irvine
Super-Kamiokande History inner detector mass: 32kton fiducial mass: 22.5kton SK-I SK-II SK-III SK-IV SK-I SK-II SK-III SK-IV Acrylic (front) + FRP (back) 11146 ID PMTs (40% coverage) 5182 ID PMTs (19% coverage) 11129 ID PMTs (40% coverage) Electronics Upgrade Energy Threshold (total electron energy) 5.0 MeV 7.0 MeV 4.5 MeV work in progress < 4.0 MeV target Michael Smy, UC Irvine
SK New Front-End Electronics: QBEE Network Interface Card Ethernet Readout PMT signal 60MHz Clock TDC Trigger Calibration Pulser QTC TDC FPGA QTC-Based Electronics with Ethernet (QBEE) • 24 channel input • QTC (custom ASIC) • three gain stages • wider (5x!) dynamic range • Pipe line processing • multi-hit TDC (AMT3) • FPGA • Ethernet Readout • 60MHz common clock • Internal calibration pulser • Low (<1W/ch!) power Michael Smy, UC Irvine
Difference in Readout System Former readout system HITSUM Hardware Trigger using number of hit (HITSUM) Former Electronics (ATM) Trigger logic Trigger (1.3msec x 3kHz) 12PMT signals per module 1.3msec event window Readout (backplane, SCH, SMP) New readout system No hardware trigger. All hits are read out. Apply software trigger. Collect ALL hits; trigger every 17msecwith a 60kHz clock without “gaps” New Electronics (QBEE) Periodic trigger (17msec x 60kHz) Clock 24PMT signals per module Variable event window by software trigger Readout (Ethernet) Michael Smy, UC Irvine
Supernova Neu-trinos Michael Smy, UC Irvine
Supernova n Burst: Expected # of Events Neutrino flux and energy spectrum from Livermore simulation (T.Totani, K.Sato, H.E.Dalhed and J.R.Wilson, ApJ.496,216(1998)) ~7,300 ne+p events ~300 n+e events ~360 16O NC g events ~100 16O CC events (with 5MeV thr.) for 10 kpc supernova Courtesy M. Nakahata, ICRR
Time Variation Measurement withne+p Assuming a supernova at 10kpc. nep e+nevents give direct energy information (Ee = En – 1.3MeV). Time variation of event rate Time variation of mean energy Enough statistics to discuss model predictions Courtesy M. Nakahata, ICRR
n+eScattering Events ne+p ne+p ne+p ne+p n+e SN at 10kpc n+e Direction of supernova can be determined with an accuracy of ~5 degree. Spectrum of n+e events can be statistically extracted using the direction to supernova. n+e n+e Neutrino flux and spectrum from Livermore simulation Courtesy M. Nakahata, ICRR
Total number of events in parentheses SN at 2kpc Close Supernovae Time variation 200 log bins from 20msec to 18sec Visible energy spectrum ~240,000 events are expected for supernova at 2kpc. ~10,000 events are ne scattering events. Courtesy M. Nakahata, ICRR
ne+nx Energy Spectrum Measurement SN at 2kpc Spectrum measurement up to ~40MeV. Courtesy M. Nakahata, ICRR
Neutronization Burst (e-+pn+ne) SN at 2kpc Number of events from 20msec to 0.1 sec (1bin=10msec) ν+e- No oscillation Normal PH=1 or Inverted hierarchy Normal hierarchy PH=0 Neutronization burst could be observed even with neutrino oscillations. Courtesy M. Nakahata, ICRR
Search for Neutronization Burst in SK-I/II expect between 1 and six events at 10kpc (depending on oscillation) • use magnitude of average direction of events within 1, 10, and 100ms: sumdir • 84% efficiency if require sumdir>0.75 • also cut on mean distance between event vertices: >94% efficiency • no cluster found with more than two events in SK-I or II • found 194/19/1 doublets within 1/10/100ms in SK-I data while expecting 194/19/2.1 • found 0/0/10 doublets in SK-II data while expecting 0.125/1.25/12.5 Michael Smy, UC Irvine
Supernova Relic Neutrinos (SRN) a diffuse neutrino signal from all past supernovae Motivation SRN measurement enables us to investigate the history of past Supernovae. The SRN flux determines the star formation rate and supernova rate in galaxies. Predicted SRN flux Expected # SRN evts in SK 10-30MeV: 0.8 -5.0 evts/22.5kt·y 16-30MeV: 0.5 -2.5 evts/22.5kt·y 18-30MeV: 0.3 -1.9 evts/22.5kt·y Courtesy Iida, ICRR
SN Relic n’s: Backgrounds in H2O spallation products from cosmic m’s atm. nm→ stealth m±→e± relic n’s Many backgrounds in SN relic n energy window: • electronic noise • solar n’s • reactor n’s • atmospheric n’s • cosmic ray m’s • spallation from m’s (~600/day) • radioactive backgrounds spallation is worst; products decay with energies up to 20.8 MeV and lifetimes up to 13.8 s (practically forever): spallation limits the energy threshold & cuts to reduce it causes greatest signal loss Michael Smy, UC Irvine
90% C.L. Flux limit: SK-I : < 1.25 /cm2 /sec SK-II : < 3.68 /cm2/sec SK-I + SK-II : < 1.08 /cm2 /sec preliminary preliminary SK-II SK-I (1496day) (791day) DATA DATA Invisible m-e decay Invisible m-e decay Atmospheric ne Atmospheric ne Spallation BG Visible energy [MeV] Visible energy [MeV] Irreducible backgrounds: Atmospheric νe cc interactions Decay of sub-Cherenkov ‘invisible μ’s’ from atmospheric νμinteractions SK-I result: M. Malek, et al, Phys. Rev. Lett. 90, 061101 (2003) Courtesy Iida, ICRR
Flux limit VS Predicted Flux Courtesy Iida, ICRR
Solar n‘s Michael Smy, UC Irvine
Solar Neutrino Future Prospects in SK Expected spectrum distortion with 5 years low BG SK data BG is 70% reduced compared to SK-I below 5.5 MeV Energy-cor. Syst. uncertainty is half compared to SK-I five years 0.8 0.6 0.4 0.2 0.0 ne survival probability (at best fit parameter) Vacuum osc. dominant P(ne ne) matter dominant SK-I transition from vacuum to matter osc. “upturn” in 8B relative spectrum. Courtesy L. Oberauer TU München (BOREXINO) Neutrino Energy in MeV Michael Smy, UC Irvine
SK-I SK-III SK-I SK-III SK-I SK-III SK-III: Less Radioactive Background z [m] 5.0-5.5MeV clean central 13.3kton 5.5-6.0MeV r2 [m2] 6.0-6.5MeV Courtesy Y. Takeuchi, ICRR
Observed 8B Flux in SK-III Data Best-fit Background consistent with SK-I within statistical uncertainty! SK-I 8B flux: 2.35±0.02(stat)±0.08(sys) x106/cm2s (PRD73: 112001, 2006) Courtesy Y. Takeuchi, ICRR
Solar Peak at 4.5 MeV Data Best-fit Background • Hint of Signal between 4.5-5.0MeV (recoil electron total energy) • Fiducial volume is central 9.0kton Courtesy Y. Takeuchi, ICRR
8B n Flux (Preliminary) SK-III 298day 5.0-20MeV Michael Smy, UC Irvine
Recoil Electron Spectrum F8B=2.36x10⁶/cm2s Fhep=15x103/cm2s (best-fit for SK-I) Michael Smy, UC Irvine
Day/Night Asymmetry • only direct test of matter effects on solar neutrino oscillations • SK-I measured ADN=2(D-N)/(D+N)=-2.1±2.0%(stat) • SK-I also fit LMA day/night variations; expressed as ADN the result is ADN=-1.8±1.6%(stat) • SK-II measured ADN=-6.3±4.2%(stat) • SK-III can measure ADN to ±4.3%(stat) with the shown 298 days of data; maybe to ±3.7%(stat) using the entire SK-III data set (including periods w/o SLE or high very low energy background runs) • SK-I-III can determine ADN to ±1.6%(stat) • SK-I-III can fit LMA D/N variations to ±1.3%(stat) Michael Smy, UC Irvine
Solar n Oscillation Constraints excluded by spectrum allowed using 8B total flux by SNO SK-III Very Preliminary excluded from spectrum & d/n variation global solar Very Preliminary SK combined Very Preliminary Courtesy Ikeda, ICRR
have 2 modules: 32 cores plan to buy four more modules: 96 cores sufficient CPU for 3MeV threshold convert inner detector hit ADC/TDC counts to real times/charges sort hits by time pre-filter based on N230 (# of hits within 230ns) SoftwareTriggered Online ReconstructionofEvents: coincidence after time-of-flight subtraction (vertex from selected four-hit combin.) fast vertex fit if fiducial, precision vertex fit if fiducial, save event Wideband Intelligent Trigger 1Gbit many “slow” ethernet lines two fast ethernet lines ProCurve Switch 10Gbit 10Gbit WIT Machine I Dual Quad-Core 3GHz CPU WIT Machine II Dual Quad-Core 3GHzCPU Michael Smy, UC Irvine
AtmosphericNeutrinos Michael Smy, UC Irvine
Atmospheric n’s: It’s not just for atmospheric mixing any more “1-2 sector” “2-3 sector” “1-3 sector” Atmospheric Solar Accelerator / reactor • Atmospheric mixing parameters: • Zenith angle analysis → mainly sin2(2θ23) • L/E analysis → mainly Δm2 • Solar term analysis → octant degeneracy • θ13 and mass hierarchy: • 3 flavors zenith angle analysis Cij=cosθij Sij=sinθij Non-standard interactions are not covered in this talk Fanny Dufour WIN09 September 2009 Courtesy F. Dufour, Boston University
Zenith angle analysis Goal is to observe a deficit of upward going neutrinos. Two-Flavor: Zenith & L/E Analysis Datasets SK-I FC/PC: 1489 days SK-I Upmu: 1646 days SK-II FC/PC: 798 days SK-II Upmu: 828 days SK-III FC/PC: 518 days SK-III Upmu: 635 days cos θzenith where 420 bins each for SK-I, II, and III; 122 syst. terms describe neutrino flux, cross section, reconstruction, and data reduction uncertainties L/E analysis Goal is to actually see the first oscillation dip. Need events with good path-length (L) and energy (E) resolution. Uses a subsample of events with good resolution. Courtesy F. Dufour, Boston University
Data MC (no oscillations) MC (best fit oscillations) Zenith Analysis Results 16 sub-samples are used for the oscillation analysis New: Sub-GeV samples subdivided to improve sensitivity to low energy oscillation effects Fanny Dufour WIN09 September 2009 Courtesy F. Dufour, Boston University
L/E analysis results Datasets SK-I FC/PC μ-like: 1489 days SK-II FC/PC μ-like: 798 days SK-III FC/PC μ-like: 518 days • We do see oscillation and not just disappearance and we compare against: • Neutrino decay (disfavored @ 4.4σ) • Neutrino decoherence (5.4σ) Grossman and Worah: hep-ph/9807511 Lisi et al.: PRL85 (2000) 1166 Barger et al.: PRD54 (1996) 1, PLB462 (1999) 462 Δm2 = 2.2 * 10-3 eV2 sin2(2θ23)=1.0 Fanny Dufour WIN09 September 2009 Courtesy F. Dufour, Boston University
Two-Flavor Results (SK I+II+III) Zenith angle analysis best fit SK-1+2+3, Preliminary L/E analysis best fit These two analyses are complementary: L/E has stronger Δm2 constraint Equally strong sin22θ23 constraint Fanny Dufour WIN09 September 2009 Courtesy F. Dufour, Boston University
Comparing with MINOS and K2K Zenith angle analysis best fit SK-1+2+3, Preliminary L/E analysis best fit The results agree well with other experiments Long baseline constrains Δm2 better Atmospheric still has stronger sin2 2θ constraint Fanny Dufour WIN09 September 2009 Courtesy F. Dufour, Boston University
Solar Term & Octant degeneracy (In constant density matter) νe flux reduction Driven by Δm212 and θ12. Addition of solar terms shows no significant deviation of θ23 from π/4. νe flux enhancement Cosine Zenith Angle Fanny Dufour WIN09 September 2009 Courtesy F. Dufour, Boston University Energy (GeV)
sin2 θ13 = 0.005 sin2 θ13 = 0.04 sin2 θ13 = 0.015 Cosine Zenith Angle Energy (GeV) Energy (GeV) Energy (GeV) θ13with atmospheric neutrinos MSW effect gives rise to additional scattering amplitudes in matter (for νe only). The clearest indication of non-zero θ13 at Super-K is a resonance @ ~2-10 GeV for up-going e-like events Normal hierarchy ⇒ neutrino enhancement Inverted hierarchy ⇒ anti-neutrino enhancement Analysis uses 3 parameters (sin2θ13, sin2θ23, Δm223) assuming a single “dominant mass scale” (Δm223 ≫ Δm212). Fanny Dufour WIN09 September 2009 Courtesy F. Dufour, Boston University
Data MC (no oscillations) MC (best fit oscillations) Three flavor Effects: Zenith Angle Data Preliminary Preliminary Clear distortion of muon-like zenith distribution, well-described by 2-flavor νμ → ντ disappearance... Allow also νμ → νe appearance in 3-flavor analysis, look for enhancement of high-energy upward-going e-like events. Preliminary No distortion in electron-like samples... no evidence for matter-enhanced νe appearance. Fanny Dufour WIN09 September 2009 Courtesy F. Dufour, Boston University
Three Flavor Results NormalHierarchy Inverted Hierarchy Data consistent with both hierarchies; no electron-like excess observed. Analysis assumes Δm212 = 0, next update will include solar terms. Fanny Dufour WIN09 September 2009 Courtesy F. Dufour, Boston University
Future:The Global Picture By combining the solar term analysis and the three flavor analysis we can get the global pictures: Analysis underway, no results yet. Fanny Dufour WIN09 September 2009 Courtesy F. Dufour, Boston University
Nucleon Decay Michael Smy, UC Irvine
Charged lepton + meson modes • 6 candidates are observed while 4.7 • events are expected from atmospheric • n B.G. • For each mode, • p→m+h(3p0) : P(≥2)= 7.5% • p→m+r : P (≥1)=34.9% • p →m+w(3p) : P (≥1)=32.3% • n →m+p- : P (≥1)=34.3% • n →e+r- : P (≥1)=31.6% • no evidence of nucleon decay. For all modes, efficiency and expected BG for SK-II is almost similar with SK-I, BG expectation is less than 0.5events. Courtesy Kaneyuki, ICRR
p→nK+ mode summary of each analysis No evidence of p→nK+ Merged lifetime limit: 2.8 x1033 years @141 kton・year (2.3x1033 years@92kton・year Phys.Rev.D 72, (2007) 052007) Efficiency for SK-II are about 80% of SK-I. Expected backgrounds for K+→m+nm+prompt g, K+→p+p0 are small. Courtesy Kaneyuki, ICRR
Summary of nucleon decay search results SK-I+II SK-I+II SK-I+II 34 10 Courtesy Kaneyuki, ICRR
Conclusions • still waiting for a galactic core-collapse supernova • still waiting for SN relic neutrinos to show up • SK electronics was upgraded successfully • now read out every hit • SK solar analysis has lower backgrounds <5.5 MeV in the center of SK, start search for “upturn” • SK-III solar results consistent with SK-I and SK-II results within statistical uncertainties • SK atmospheric neutrinos still dominate atmospheric mixing angle constraints and contribute to mass splitting • SK atmospheric neutrinos start to constrain 1-3 mixing • full three-flavor analysis in preparation • SK has not yet found proton decay; sets the best limits