Download
1 / 17
170 likes | 281 Views
Identifying and Treating Patients with Insulin Resistance. Diagnosis of diabetes, IFG, and IGT. Plasma glucose (mg/dL). Fasting. 2-hr postload*. Casual. ≥200 – 140 to 199 (ADA) >140 to <200 (AACE). ≥126 100 to 125 (ADA) >110 to ≤126 (AACE) –. Diabetes

E N D
Diagnosis of diabetes, IFG, and IGT Plasma glucose (mg/dL) Fasting 2-hr postload* Casual ≥200 – 140 to 199 (ADA) >140 to <200 (AACE) ≥126 100 to 125 (ADA) >110 to ≤126 (AACE) – Diabetes Impaired fasting glucose (IFG) Impaired glucose tolerance (IGT) ≥200 – – *Following equivalent of 75 g anhydrous glucose in water ADA. Diabetes Care. 2005;28(suppl 1):S4-36.AACE. Endocr Pract. 2003;9:240-52.
Metabolic syndrome diagnosis: ATP III emphasizes clinical practice • Risk factor Defining level • Abdominal obesity (in) Waist: Men >40 Women >35 • Triglycerides (mg/dL) ≥150 • HDL-C (mg/dL) Men <40 Women <50 • BP (mm Hg) ≥130/≥85 • Fasting glucose (mg/dL) ≥110 (ADA ≥100) NCEP ATP III. JAMA. 2001;285:2486-97.
Metabolic syndrome diagnosis: IDF emphasizes central obesity Plasma triglycerides >150 mg/dL* HDL-C <40 mg/dL* BP 140/90 mm Hg* Fasting glucose 100 mg/dL or previously diagnosed type 2 diabetes International Diabetes Federation Central obesity • Plus any 2 of the following: • Defined according to waist circumference (ethnic- and gender-specific) www.idf.org. Accessed August 2005. *Or receiving specific treatment for this abnormality
IDF ethnic- and gender-specific criteria for central obesity European37 32 Sub-Saharan African Middle Eastern South Asian35 32 South/Central American Chinese35 32 Japanese34 35 Waist circumference (inches) Men Women www.idf.org. Accessed August 2005.
Metabolic syndrome diagnosis: WHO emphasizes central role of insulin resistance Insulin resistance • Type 2 diabetes, or • Impaired fasting glucose, or • If fasting glucose <110 mg/dL, glucose uptake below lowest quartile Plus any 2 of the following: • Antihypertensive medication and/or BP ≥140/90 mm Hg • Plasma triglycerides ≥150 mg/dL • HDL-C <35 mg/dL (men) or <39 mg/dL (women) • BMI >30 kg/m2 and/or waist-hip ratio >0.9 (men); >0.85 (women) • Urinary albumin excretion rate ≥20 µg/min or albumin-creatinine ratio ≥30 mg/g Grundy SM et al. Circulation. 2004;109:433-8.Adapted from Alberti KG, Zimmet PZ. Diabet Med.1998;15:539-53.
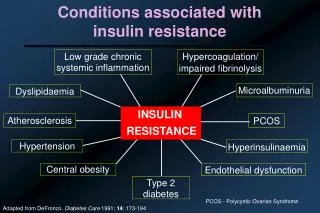
Other markers of insulin resistance • Family history of type 2 diabetes or CAD • Overactive sympathetic nervous system • Uric acid Cohn GS et al. Am J Hypertens. 2005;18:1099-103.
ABCs of coronary prevention Adapted from Cohen JD. Lancet. 2001;357:972-3.
Multidisciplinary consensus on managingmetabolic syndrome AHA / NHLBI / ADA • Modify lifestyle (weight loss, physical activity) • Assess risk • Framingham Risk Score • CRP (optional) • Reduce risk factors (ATP III, JNC 7, ADA) • Lipids, BP, thrombosis, glucose “There is growing interest in the possibility that drugs that reduceinsulin resistance will delay onset of type 2 diabetes and will reduceCVD risk when the metabolic syndrome is present.” Grundy SM et al. Circulation. 2004;109:551-6.
DPP: Impact of lifestyle intervention or metformin on diabetes 40 Placebo N = 3234, no diabetes Age 50 207 lbs Glucose 107 P 30 Metformin < 0.001 31% Cumulative incidence of diabetes (%) 20 Lifestyle 58% < 0.001 • Lose 5–10 lbs • Exercise 2.5 hrs/wk 10 0 0 0.5 1.0 1.5 2.0 2.5 3.0 3.5 4.0 Year DPP = Diabetes Prevention Program DPP Research Group. N Engl J Med. 2002;346:393-403.
UKPDS: Comparison of tight control of BP vs glycemia on risk of diabetes complications Any diabetes-related outcome Diabetes-related death Coronaryheart failure Micro-vascular Retinopathy Stroke 0 –10 –20 %Patients –30 –40 –50 –60 Tight BP (144/82 vs 154/87 mm Hg) Tight glucose (A1C 7% vs 7.9%) UKPDS = UK Prospective Diabetes Study UKPDS Group. BMJ. 1998;317:703-13.
HPS and CARDS: Benefits of lowering LDL-C in diabetes Event rate (%) Δ LDL-C(mg/dL)* Statin better Placebo better Statin Placebo P HPS 0.73 34.8 9.4 9.3 5.8 12.6 13.5 9.0 <0.0001 0.0003 0.001 All diabetes 0.67 34.8 Diabetes, no CVD 0.63 46.4 CARDS 0.5 0.7 0.9 1 1.7 Relative risk *Statin vs placebo HPS = Heart Protection Study CARDS = Collaborative Atorvastatin Diabetes Study HPS Collaborative Group. Lancet. 2003;361:2005-16.Colhoun HM et al. Lancet. 2004;364:685-96.
ASCOT-LLA: Atorvastatin reduces CV events in patients with diabetes and hypertension N = 2532, baseline LDL-C 128 mg/dL 14.0 Placebo 12.0 23% Risk reduction P = 0.036 10.0 8.0 % 6.0 Atorvastatin 10 mg 4.0 2.0 HR = 0.77 (0.61–0.98) 0.0 Years 0.0 0.5 1.0 1.5 2.0 2.5 3.0 3.5 Number at risk 1258 1231 1209 1191 1171 1065 699 370 Placebo 1274 1237 1219 1200 1175 1058 714 375 Atorvastatin Nonfatal MI, CV mortality, UA, stable angina, arrhythmias, stroke, TIA, PAD, retinal vascular thrombosis, revascularization ASCOT-LLA = Anglo-Scandinavian Cardiac Outcomes Trial–Lipid Lowering Arm Sever PS et al. Diabetes Care. 2005;28:1151-7.
MICRO-HOPE, PERSUADE: Reduction in primary outcome with ACEI 25 25% Risk reduction RR 0.75 (0.64–0.88) P = 0.0004 Placebo 20 15 % Ramipril 10 mg 10 5 0 0 1 2 3 4 5 Follow-up (years) MICRO-HOPE (N = 3577) CV death/MI/stroke PERSUADE (N = 1502) CV death/MI/cardiac arrest 25 Placebo 20 19% Risk reduction P = 0.131 15 Perindopril 8 mg 10 5 0 0 1 2 3 4 5 Follow-up (years) HOPE Study Investigators. Lancet. 2000;355:253-9. Daly CA et al. Eur Heart J. 2005;26:1369-78.
Steno-2 supports aggressive multifactorial intervention in type 2 diabetes Objective: Target-driven, long-term, intensified intervention aimed at multiple risk factors compared with conventional therapy Design: N = 160 patients with type 2 diabetes and microalbuminuria Intensive treatment targets: BP <130/80 mm Hg A1C<6.5% Total-C <175 mg/dL Triglycerides <150 mg/dL Gæde P et al. N Engl J Med. 2003;348:383-93.
Steno-2: Effects of multifactorial intervention on CV outcomes 53% risk reductionP = 0.01 N = 160 with type 2 diabetes and microalbuminuria 60 50 Conventional Primary composite outcome* (%) 40 30 20 Intensive 10 0 0 12 24 36 48 60 72 84 96 Follow-up (months) Gæde P et al. N Engl J Med. 2003;348:383-93. *CV death, MI, stroke, revascularization, amputation
Summary • The majority of patients seen in cardiology practices have insulin resistance • Synergistic interaction of risk factors associated with insulin resistance places patients at high risk for CV disease • Current guidelines recommend aggressive multi-factorial treatment in patients with diabetes or prediabetes • PPAR modulation is a potentially important strategy for improving insulin sensitivity and blunting atherosclerosis progression