Download
1 / 6
190 likes | 570 Views
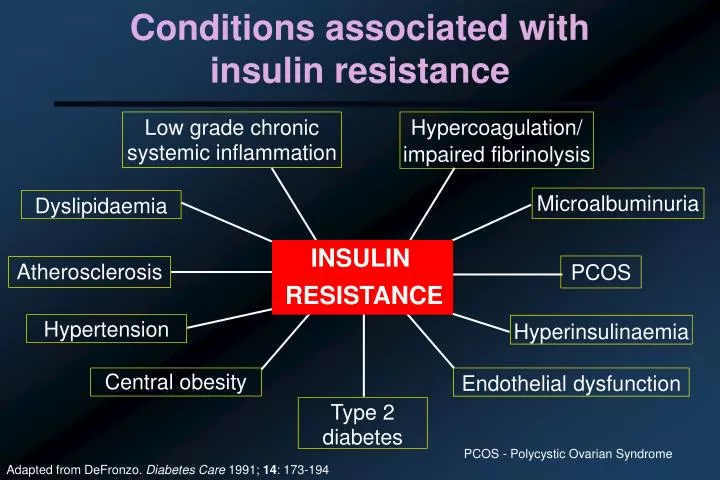
Low grade chronic systemic inflammation. Hypercoagulation/ impaired fibrinolysis. Microalbuminuria. Dyslipidaemia. PCOS. Atherosclerosis. Hypertension. Hyperinsulinaemia. Central obesity. Endothelial dysfunction. Type 2 diabetes. PCOS - Polycystic Ovarian Syndrome.

E N D
Low grade chronic systemic inflammation Hypercoagulation/ impaired fibrinolysis Microalbuminuria Dyslipidaemia PCOS Atherosclerosis Hypertension Hyperinsulinaemia Central obesity Endothelial dysfunction Type 2 diabetes PCOS - Polycystic Ovarian Syndrome Conditions associated withinsulin resistance INSULIN RESISTANCE Adapted from DeFronzo. Diabetes Care 1991; 14: 173-194
Progressive decline of HOMAbeta-cell function over time 100 Start of treatment 80 60 HOMA beta-cell function(%) p<0.0001 40 20 Diet-treated, n=376 0 -10 -9 -8 -7 -6 -5 -4 -3 -2 -1 0 1 2 3 4 5 6 Time from diagnosis (years) Adapted from UKPDS 16.Diabetes. 1995; 44: 1249-1258
Beta-cell dysfunction in diabetes Insulin secretion inlean mouse Insulin secretion indiabetic mouse Lister CA et al. Diabetologia 1998; 41 (Suppl 1): A169. Abstract 660
Homeostasis Model Assessment (HOMA) • Clamp technique measures under hyperinsulinaemic conditions1 – considered the ‘gold standard’ • HOMA estimates insulin sensitivity and beta-cell function using fasting insulin and glucose2 from a single sample and correlates well with other insulin sensitivity tests • Well correlated with other insulin sensitivity tests (eg intravenous glucose tolerance test) andbeta-cell function tests (eg hyperglycaemic clamp) 1. DeFronzo RA et al. Am J Physiol 1979; 237: E214-E2232. Matthews DR et al.Diabetologia 1985; 28: 412-419
20 insulin* (mU/ml) glucose* (mmol/l) - 3.5 Beta-cell function (%) = insulin* (mU/ml) glucose* (mmol/l) 22.5 Insulin resistance = Homeostasis Model Assessment (HOMA) Normal: 100% beta-cell function: insulin resistance (R) = 1 *fasting levels Haffner S. Diabetes Care 1996; 19: 1139
Homeostasis Model Assessment (HOMA) 50 40 30 20 10 0 Decreasing b-cell function (b) b=200% b=100% Increasing insulin resistance (R) R=16 Basal plasma insulin (mU/ml) b=50% R=8 b=25% R=2 R=4 R=1 R=2 R=½ 2 4 6 8 10 12 14 Basal plasma glucose(mmol/l) Matthews et al. Diabetologia 1985; 28: 412