Download
1 / 29
300 likes | 442 Views
The Future of Profiling Floats in Global Ocean Observations. D. Roemmich, S. Riser, G. Johnson, B. Owens, S. Garzoli, M. Belbeoch, J. MacKinnon Ocean Climate Observation Annual System Review Silver Spring October 27-29, 2010. The future of profiling floats.

E N D
The Future of Profiling Floats in Global Ocean Observations D. Roemmich, S. Riser, G. Johnson, B. Owens, S. Garzoli, M. Belbeoch, J. MacKinnon Ocean Climate Observation Annual System Review Silver Spring October 27-29, 2010
The future of profiling floats • The highest priority is to sustain the core Argo array. • New float designs increase efficiency and capabilities. • Enhancing Argo (per OceanObs’09) can further increase its value: • Bi-directional communication (Iridium, ARGOS-3) for • Shortened surface time. • Surface layer sampling. • High resolution profiles for ocean mixing. • Active management of the array. • Expanded domain: high latitudes (ice) and marginal seas. • Deep floats for sampling to the ocean bottom to close the global heat and sea level budgets. • New sensors (O2, pH, Chl, carbon, nitrate, …) to observe ecosystem and geochemical impacts of climate change. • Boundary current sampling using floats and gliders. • Autonomous instruments are revolutionizing the observing system, making the global ocean accessible to cost-effective sampling.
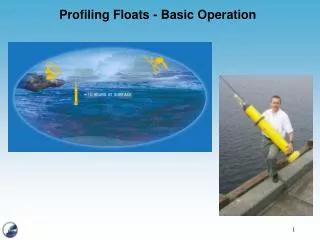
New float designs increase efficiency and capabilities. Next-generation floats are smaller, lighter, more capable, and longer-lived. SOLO-II float (left), with SOLO-I ARVOR (NKE) float
Bi-directional communication (Iridium, ARGOS-3) • Feasibility: High. • 209 floats presently use Iridium. • Will increase rapidly. • ARGOS-3 on the way. • Cost: Low. • Hardware is inexpensive • Communications costs are low. • Energy usage is less. • Value: High. • Short surface time (15 mins): less grounding, less bio-fouling, less energy. • High bandwidth enables new applications (near-SST, mixing, …). • 2-way enables active management (new applications, position control, recovery, …)
SST/SSS sampling: Specialized floats A second CTD samples the surface layer. T (C) 0.5 1 30.8 2 30.4 3 Depth (m) 30.0 4 T (C) 29.6 5 Temperature and salinity in depth and time at 2 hour intervals, for the upper 5 m, from UW float 6117. Data were collected every 7 cm. A strong diurnal cycle can be seen in T and to a lesser extent in S. 6/24 6/30 7/6 7/12 7/16 S (PSU) 0.5 34.3 1 34.2 2 34.1 3 Depth (m) 34.0 4 33.9 S (PSU) 33.8 5 6/24 6/30 7/6 7/12 7/16
SST/SSS sampling: Standard floats Present floats stop at ~5 m New floats could sample to ~1m
High vertical resolution: ocean mixing e.g. MacKinnon et al., 2010 (OO’09 white paper) Time-averaged vertical wavenumber spectra of vertical strain for different depth bins, from near surface (red) to deep (blue). Black line is Garrett-Munk Depth-averaged map of diapycnal diffusivity (colors), on bathymetry, for this float trajectory, from strain spectra, using method of Kunze et al. (2006) Depth-time map of diapycnal diffusivity. With high vertical resolution, one can also estimate overturning scales (Thorpe scale).
Active array management • By changing Zpark, Zprofile, Tcycle, Tsurf underway: • Control float location (time-series float, grounding avoidance, float recovery) • Do floats with short Tsurf have much less tendency to ground? • Can varying Tsurf be effective for controlling location (vsurf >> vpark)? • Enable new applications (tropical cyclone studies, tropical intraseasonal variability, boundary current enhancements, …) Left: McPhaden et al., 2009 study of “Ocean-atmosphere interactions during cyclone Nargis”, using Argo profiles. Right: Matthews et al., 2009 study of “Ocean temperature and salinity components of the MJO observed by Argo floats Argo could provide many more profiles for regional phenomena.
Argo in the seasonal ice zones There are 148 active Argo floats with ice-detection software. Life expectancy is less than other floats, but not drastically so. Ice-detecting floats deployed in 2007: All other floats deployed in 2007: 81 deployed, 50 active (62%) 8022 completed cycles (99/float) 669 deployed, 483 active (72%) 67334 completed cycles (101/float)
Argo in the seasonal ice zones Wintertime ice cover, showing the region occupied by the float Map showing all floats and the circulation in this region of the Antarctic [from Wong and Riser, 2010, submittted to JPO] T, S, , and BV-frequency from a UW float near Wilkes Land, east Antarctica from February, 2007 through April, 2010
Argo in the deep ocean • Strong scientific rationale (global ocean heat and FW content, steric sea level, deep circulation – MOCs,…, e.g. Garzoli et al, OO’09 WP) • Technically feasible, though difficult. Technology development needed in both floats and sensors. • Recover and recalibrate some deep floats ?? • Argo and commercial partners are ready to start ! Sea level rise (SLR, mm/yr) due to thermal expansion below 4000 m, and 1000 – 4000 m south of the SAF. (Purkey and Johnson, 2010)
New sensors: O2, Bio-optics, NO3, pH, to observe geochemical and ecosystem impacts of climate APEX float with O2 and NO3. • Presently active floats with additional sensors. • Issues include: • Sensor cost and stability • Impact on float’s energy budget • Data management cost • Implications for EEZ access
Additional sensors: O2, Bio-optics, NO3, pH • Oxygen • Over 300 floats with O2 sensors deployed globally since 2003, by at least 11 countries. • General assessment: while issues remain (stability, calibration, D-mode QC), these are nearly ready for large-scale deployment. • Bio-optics (fluorometry and backscatter) • Small number deployed (12); reliability issues. • High potential; more demonstration-mode deployments needed. • Dissolved nitrate • Small number deployed (8), 30 more funded. • ISUS sensor appears stable and scientifically valuable. • pH – sensor under development Summary: O2 nearly ready for large-scale deployment in Argo. Others have high potential value but need to be deployed in increasing numbers and issues addressed (sensor stability, data management, array design).
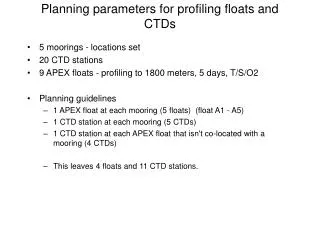
Sampling boundary current regions with floats and gliders • Objectives include basin-wide volume and heat transport, air-sea exchange. • Glider sampling will focus on transects at “special locations” and likely be managed separately from Argo (see CORC report by Send et al.) • The Argo design should be revisited for enhanced sampling density in WBC regions (Cronin et al.,OO’09 WP) using: • Increased deployments. • Bi-direction communication to shorten cycle time for floats in WBC regions. • Active array management to keep floats in WBC regions. WBC regions identified by Cronin et al (2010) for enhanced Argo sampling: 1o x 2o x 5 days Argo has had enhanced sampling of the KOE region thanks to KESS and other partners.
The future of profiling floats • The highest priority is to sustain the core Argo array. • Enhancing Argo will increase its value for climate services: • Improve the evaluation of ocean heat content, and close global heat and sea level budgets by sampling the missing half of the ocean > 2000m. (Deep Argo) • Improve understanding of deep ocean circulation and water mass formation (e.g. MOC, high latitude fresh water balance) (Deep Argo) • Provide information on near-surface variability (SSS, SST) to complement satellite observations. • Explore the high latitude oceans for quantifying and understanding climate change in these key regions. (Ice floats) • Observe the geochemical and ecosystem impacts of climate (New sensors) • Sample WBC regions to constrain basin-wide transport estimates and air-sea interaction. (Floats and gliders) • Profiling floats and gliders provide a cost-effective means of observing the global subsurface ocean.
Appendix to:The Future of Profiling Floats S. Riser Ocean Climate Observation Annual System Review Silver Spring October 27-29, 2010
Dissolved Oxygen Measurements from Profiling Floats • Over 300 floats with O2 sensors deployed globally since 2003, by at least 11 countries. • 2 types of O2 sensors: SeaBird IDO and Aanderaa Optode. Marginal hardware cost $5K. • Presently, most groups are using the Aanderaa sensor due to its excellent stability over times of several years. • Calibration is an issue for both types of sensors, especially the Aanderaa. • Efforts are now underway by several groups to improve calibration of these sensors and to learn to do delayed-mode corrections. In general, calibration and adjustment of these sensors are more difficult than the analogous procedures for salinity, due to the lack of a good O2 climatology and the more complicated T/p effects present in these sensors. A meeting at IFREMER of interested groups is planned for June, 2011 to discuss these issues in detail. • Even with the present limitations of these sensors there have been new and important scientific results published based on their use on floats (Koertzinger et al., 2004, Science; Riser and Johnson, 2008, Nature). • General assessment: while issues remain with these sensors (stability, calibration, integration into the Argo data stream), we are much closer to being able to deploy these in large numbers with some confidence than we were just a few years ago.
An example of over 3 years of dissolved O2 data, plotted against temperature, for 2 floats in the Pacific. Both were equipped with SeaBird IDO sensors. Note the very high stability (i.e., the lack of scatter in the O2/T diagrams) over this time, 1 mol/kg or less. Approximately 50% of the SeaBird sensors show this behavior, but the others often exhibit more serious sensor drift that make the data problematic.
Long-term Stability of O2 Sensors on Floats uncal O2 T T cal O2 cal O2 uncal O2 Float 2900541 Float 2900940 One attempt at calibration/adjustment: data from floats in the western N. Pacific were compared to nearby, high-qualty contemporaneous shipboard Winkler data. Results: We know that the near-surface ocean is usually within a few per cent () of dissolved O2 saturation; the saturation value is usually mostly a function of temperature, as can be seen with the float 2900541 (left panel). But sometimes other factors, such as biological production, drive the degree of saturation rather than temperature, as with float 2900940 (right panel). In either case, we can correct the measurements to an accuracy of about 4% using shipboard data. For better accuracies than this, pre-deployment laboratory calibration of each individual sensor is required.
Dissolved Nitrate Measurements from Profiling Floats • 8 floats with NO3 sensors have been deployed since 2006, all by UW/MBARI collaboration. • All floats deployed so far use a version of the In Situ Ultraviolet Spectrophotometer (ISUS) developed at MBARI (see Johnson and Coletti, 2002, Deep-Sea Research). • UW and MBARI have worked together to adapt this sensor for use on profiling floats, with 30 more (Argo-equivalent) floats with this sensor to be deployed in the next 18 months. Funding for this work has come from NSF and ONR. Presently all floats with ISUS have been built jointly in labs at UW and MBARI, limiting the number of floats that can be produced. • A joint effort between UW, MBARI, Teledyne/Webb, and Satlantic is now underway to produce a commercial version of an Apex float with an ISUS sensor, so that this technology can become more widely available. This work has been funded by ONR via NOPP. It is hoped that a commercial version will be available early in 2012. Marginal hardware cost in the commercial version is estimated to be $12K. • The profiling float version of the ISUS sensor appears to be very stable and useful scientifically; see the recent paper by Johnson, Riser, and Karl (2010, Nature). Long-term deployments (> 2 years) demonstrate that in most cases the sensor is stable to about 1 mol/kg in NO3 over these periods. • There is not yet a provision for including the NO3 data from these floats in the Argo data stream or for carrying out delayed-mode QC on the data.
SeaBird 41-CP CTD Iridium antenna ISUS (embedded in CTD outflow) Optode O2 sensor In the present profiling float configuration of ISUS the sensor is located in the fluid circuit of the CTD unit, downstream of the T and conductivity sensors. ISUS floats generally include an Aanderaa Optode O2 sensor as well. The ISUS uses a light source and a mirror to estimate the spectral characteristics of nearby seawater. These spectra allow the NO3 concentration to be deduced very accurately. The spectra are analyzed on board the float, but as a check and in order to determine the NO3 concentration with the highest accuracy possible the spectra must be transmitted in the data stream, which requires the use of Iridium communications.
Bio-optical and pH Measurements from Profiling Floats • 12 floats with bio-optical sensors have been deployed globally since 2005, by several groups in several countries. • Most of these floats use a version of the FLBB (fluorometry and backscatter) sensor sold by WebLabs, Inc. This sensor yields estimates of chlorophyll and particulates as a function of depth. • Some of these floats have been built by individual PIs, while others have been purchased commercially (from Teledyne/Webb, for example). The reliability of the FLBB sensor and its predecessors has been somewhat of a problem. In many cases the sensor failed at high pressure after just a few cycles. The manufacturer has attempted to remedy this problem, and the most recent models appear to be much improved in this respect. • The FLBB (and predecessors) appears to be a useful scientific tool in many instances, in spite of the reliability problems (see Boss et al., 2008, Limnology and Oceanography, for an example). • A new pH sensor is under development through a NOPP-funded consortium consisting of MBARI, UW, Scripps, and Honeywell. This sensor uses ISFET (ion-sensitive field-effect transistor) technology and promises a highly accurate, stable ( 0.01 pH units over several years), and inexpensive (hardware costs < $4K) way to measure pH in the ocean. Laboratory tests have been underway for several years at MBARI and the first deployment on a profiling float are scheduled for early in 2011. This sensor should eventually have numerous applications is studies of ocean acidification and biogeochemical processes.
The Use of Profiling Floats in Ice-covered Regions • Nearly 100 floats have been deployed in ice-covered regions (mostly in the Antarctic) by US and German scientists since 2005. • These floats all use an ice-sensing algorithm based on the temperature of the mixed layer. In winter, the temperature of the surface mixed layer under the ice (typically 50-100 m thick) is within 0.02C of the freezing point; the floats monitor the mixed layer temperature as they ascend, compute the median temperature in the ML, and then make a decision whether or not to continue to the surface and attempt to transmit the data (if the median temperature is far enough above the freezing point, implying no ice cover) or to store the data and descend back to the parking depth (if the median temperature is close to the freezing point). • The US floats all use Iridium communications and have the ability to store up to 66 complete profiles (T, S, and O2 at 2 decibar intervals from 0-2000 m) and transmit these data when no ice is detected. Over 80% of the US floats survived at least 3 winters in the Antarctic (no reliability statistics are available for the German floats). • The floats can be tracked while under the ice using low-frequency, moored acoustic sources (i.e., RAFOS tracking). This has been used successfully for floats in the Weddell Sea, where there is a German sound source array. In other parts of the Antarctic where no acoustic array is present, positions under the ice must be interpolated from known surface positions when the floats transmit; as deep flows are generally weak, this has not proven to be a serious problem. • US deployments are now beginning in the Arctic (2 floats in 2010, 4 in 2011) in a UW project funded by NASA.
Wintertime ice cover, showing the region occupied by the float Map showing all floats and the circulation in this region of the Antarctic [from Wong and Riser, 2010, submittted to JPO] T, S, , and BV-frequency from a UW float near Wilkes Land, east Antarctica from February, 2007 through April, 2010
Near-surface Sampling of T and S from Profiling Floats • Most profiling floats shut down the CTD pump at a depth of about 4 meters in order to keep near-surface contaminants out of the CTD cell. This helps to maintain the CTD accuracy over long periods, but it means that generally there are no true SST and SSS measurements collected from profiling floats. This might be a problem in some potential applications of the data. • In order to attempt to collect some usable SST data, a subset of floats recently deployed by several groups has continued to collect T data all the way to the sea surface, even after the pump has been turned off. This results in 4-8 additional measurements of T between about 4 meters and the sea surface. This is possible because of the combined effects of diffusion and Bernoulli flushing of the CTD cell as the float continues to rise (but with the CTD pump off, S measurements cannot be made reliably in this way). This procedure requires almost no additional cost or energy (although it does require changes in the Argo data system) and could probably be carried out more extensively in the future if the SST community wanted it done. Preliminary discussions have taken place with the GHRSST community as to whether this is a useful practice on Argo floats, with no definitive conclusions yet. Additional QC of T data collected in this way will be required. • A second way to measure near-surface T (and S) is to add an additional CTD unit that only operates near the sea surface. This has been done on approximately 20 UW floats deployed globally, with another 40 or so to be deployed in the next 2 years; this work has been funded by NASA. In this case the auxillary CTD unit collects high-resolution CTD data in the upper 30 m of the water column, all the way to the sea surface (at approximately 10 cm intervals). Between depths of 30 m and 4 m the auxlliary unit can be recalibrated against the main CTD on each profile, insuring high quality T and S data all the way to the sea surface. The marginal cost of this hardware is about $3K.
Measuring SST (or near-surface T ) from ARGOS floats: 8 points above 4 m Negligible energy cost: this requires 1 extra ARGOS message In the near-surface region, unpumped T samples are collected, then the pump is turned on and pumped samples are collected for comparison; above 4 m only unpumped samples are collected. From 10 floats used in this test, the pumped and unpumped samples agree to 0.02C, indicating that good near-surface T measurements can be made in this way. Data shown from UW float 6023 (WMO 5902077) in the Indonesian throughflow
Main SBE 41cp CTD unit Auxiliary near-surface CTD unit Example of a float equipped with an auxillary near-surface CTD unit. Due to the large quantity of data transmitted by these floats, Iridium communications is used.
T (C) z (m) 0 30 100 25 200 20 T (C) 300 15 400 10 UW float 6117 (WMO 5902125) 500 4/4 5/4 6/3 7/3 8/2 9/5 S (PSU) 0 3/24/09 35.4 9/15/09 100 35.2 1 day intervals (150 m) 35.0 200 10 day intervals (1000 m) 34.8 34.6 300 S (PSU) 34.4 34.2 400 34.0 500 4/4 5/4 6/3 7/3 8/2 9/5 Temperature and salinity from UW float 6117 in the western Equatorial Pacific: upper 500 m at 10-day intervals (the float collected data from 0-2000 m).
T (C) 0.5 1 30.8 2 30.4 3 Depth (m) 30.0 4 T (C) 29.6 5 6/24 6/30 7/6 7/12 7/16 S (PSU) 0.5 Temperature and salinity in depth and time at 2 hour intervals, for the upper 5 m, from UW float 6117. Data were collected every 7 cm. A strong diurnal cycle can be seen in T and to a lesser extent in S. 34.3 1 34.2 2 34.1 3 Depth (m) 34.0 4 33.9 S (PSU) 33.8 5 6/24 6/30 7/6 7/12 7/16