Download
1 / 19
190 likes | 359 Views
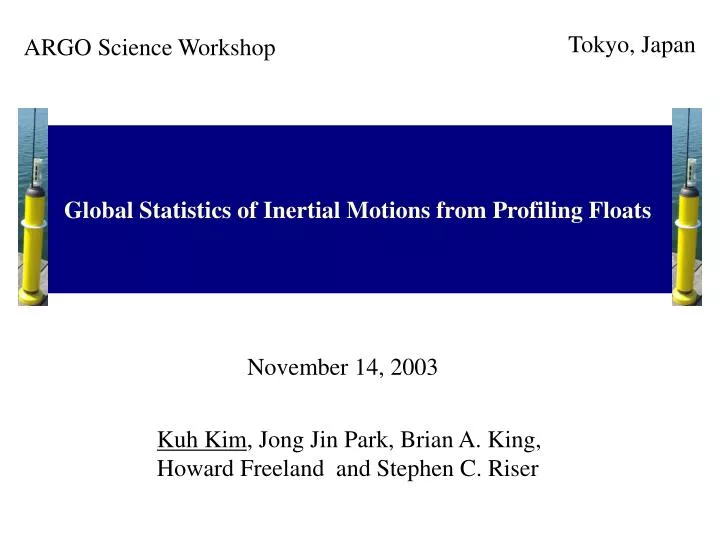
Tokyo, Japan. ARGO Science Workshop. Global Statistics of Inertial Motions from Profiling Floats. November 14, 2003. Kuh Kim , Jong Jin Park, Brian A. King, Howard Freeland and Stephen C. Riser. 10km. 10km. Example of Profiling Float Trajectory. North Pacific ID : 21852. 2001

E N D
Tokyo, Japan ARGO Science Workshop Global Statistics of Inertial Motions from Profiling Floats November 14, 2003 Kuh Kim, Jong Jin Park, Brian A. King, Howard Freeland and Stephen C. Riser
10km 10km Example of Profiling Float Trajectory North Pacific ID : 21852 2001 Oct. 7 ~ Nov. 6 ~10days ~19 hours Poster Presentation An advanced method to estimate deep currents from Profiling Floats
Introduction • Inertial motion : producing mixing in the upper pycnocline [Gregg, 1984] and a prominent source of energy for deep ocean internal waves [Gill, 1982]. • Inertial motion generates by local wind stress. (Pollard and Millard, 1970; Pollard, 1980; D’Asaro, 1985) • Seasonal variation of the energy flux from the wind based on Pollard-Millard Model (modified) and wind data (D’Asaro,1985) • Extract inertial amplitude from surface trajectory of Profiling Float
Historical Measurements of Surface Inertial Amplitude CM : Current meter, CMD : Current Meter Drifter FLIP : Research Platform
Water Following Characteristics of Profiling Float 36 35 39 38 37 Surface drifter trajectory Profiling float Surface trajectory QuikSCAT 1999 Wind vector (11/6 12:00) Latitude (°N) Latitude (°N) Surface drifter trajectory Profiling float Surface trajectory Quikscat 1999 Wind vector (11/3 00:00) 565554 646362 Longitude (°W) Longitude (°W)
Inertial Motion from Profiling Float : Method m : cycle number Weighted Function Fitting Method (uL, vL) : Linear velocity (xo, yo) : Reference position at time t1 (xi, yi) : Inertial origin : 1000m for class 1, 350m for class 2, 150m for class 3 (Weight)
(%) Local Inertial Period Data Length Error Estimation Inertial amplitude errors in case of 6 fixes (left) and position error of 500m (right) which are estimated with a numerical error simulation. Inertial Amplitude Error (cm/s) Position Error : 500m Inertial Amplitude Error (cm/s) Number of Fixes : 6 (%) Local Inertial Period Data Length The error in the inertial amplitude estimated from the fitting method is mostly dependent on accuracy of measured positions and total data length of a surface trajectory.
Global Statistics Surface drift time > 0.8 x Inertial Period (# of data : 1713) Surface drift time > 0.6 x Inertial Period (# of data : 9969) (# of data : 9969) (# of data : 1713) ~ 68% = 14.8 cm/s ~ 68% =15.1 cm/s
Data Positions in a cycle whose data length is more than 68% of local inertial period 1997/08/01~2003/08/31 Purple (JMA) , Red (AOML) , Blue (Coriolis) ,Green (Meds) , Black, Gray, and Cyan (Authors) Using temperature profiles from Profiling Floats and wind speed from Quikscat scatterometer.
Global Statistics (# of data : 4096) (# of data : 9969) (# of data : 4294) (# of data : 1579)
Statistics in the North Atlantic and the North Pacific North Pacific North Atlantic ~68% ~68% 11.7 10.5 14.5 12.9 15.8 18.1 14.4
Seasonal Statistics in the North Atlantic & the North Pacific North Atlantic (30~65N) Summer (Jun.~Sep.) Winter (Jan.~Apr.) North Atlantic North Atlantic Summer (Jun.~Sep.) Winter (Jan.~Apr.) North Pacific (30~65N) North Pacific North Pacific
Summary & Discussion (Unit = cm/s)
MLD and Inertial Amplitude Relationship North Pacific (30~45N) Aug. 1999 ~ Dec. 2002 Wind Speed = 4~8 m/sec T(z) Mixed Layer Depth (m) H Inertial Amplitude (cm/s) • MLD from Profiling Floats at the same cycle • Wind Speed from QuikSCAT scatterometer
Seasonal and Meridional Variation of MLD and Wind Speed Monthly Mean Mixed Layer Depth (from Profiling Floats) North Pacific (60W~20W) North Atlantic (160E~160W) Monthly Mean Wind Speed (from QuikSCAT Scatterometer) North Atlantic (160E~160W) North Pacific (60W~20W) 55~65N 55~65N 35~45N 35~45N 15~25N 15~25N
60N 50N 40N 30N 20N 160W 120W 100W 140W Temporal Variation of Surface Inertial Amplitude : Energy flux from the wind into the inertial motions (D’Asaro, 1985) North Pacific (50~65N) Energy Flux( )
Temporal Variation of Surface Inertial Amplitude North Pacific (30~45N) : Energy flux from the wind into the inertial motions (D’Asaro, 1985) North Pacific (30~45N) North Pacific (50~65N) Energy Flux( )