Download
1 / 21
220 likes | 305 Views
NEXT-GENERATION ACOUSTIC WIND PROFILERS. Stuart Bradley 1,2 Sabine Von Hünerbein 2 1 Physics Department, University of Auckland, New Zealand 2 Acoustics Research Centre, University of Salford, UK. LIDAR Scatters light from natural particles Lowest height 40m Highest reading 150m

E N D
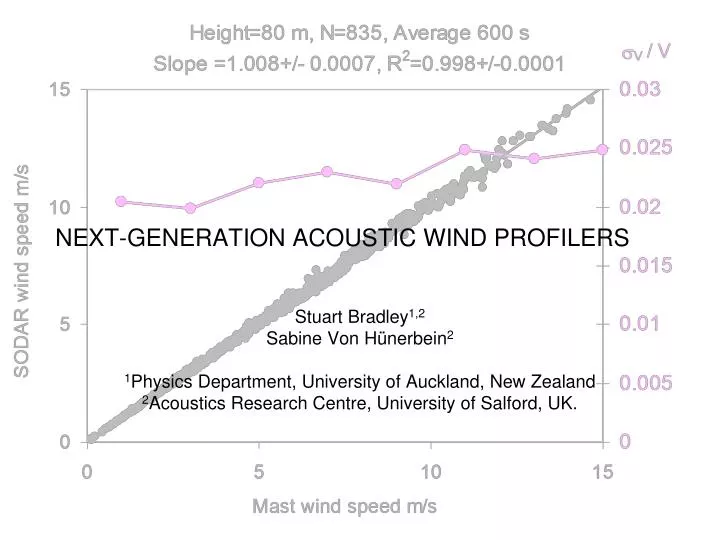
NEXT-GENERATION ACOUSTIC WIND PROFILERS Stuart Bradley1,2 Sabine Von Hünerbein2 1Physics Department, University of Auckland, New Zealand 2Acoustics Research Centre, University of Salford, UK.
LIDAR Scatters light from natural particles Lowest height 40m Highest reading 150m Averaging time 10 min Cost €150 k Maintenance: currently high, longer term unknown SODAR Scatters sound from turbulent temperature variations Lowest height 10m Highest reading 1000m Averaging time 10 min Cost €35 k Maintenance: currently low and well-established The Two Existing Technologies
AeroVironment calibration vs height A careful, unbiased field trial Calibration uncertainty 0.1% Variation with height 0.3% • Cup-cup variation equivalent • to SODAR-cup variation Cup vs SODAR residuals Cup vs Cup residuals
Height [m] 140 ZephIR (Albers) 120 ZephIR (Mikkelsen) ZephIR (Kindler) 60 ZephIR (Courtney) 40 SODAR (Bradley) 20 0 -5 -4 -3 -2 -1 0 1 Slope Error [%] LIDAR vs SODAR Performance? Difficult to find independent comparisons which compare LIDARs and SODARs under similar conditions !
Are Comparisons Reliable? • Many comparisons and field tests are done by companies or institutions which have major financial commitments (ownership of instruments, dependency on grants, development contracts, etc), particularly with the more expensive LIDARs. This can mean they concentrate on the product which has the greatest financial impact on them • Many comparisons and field tests do not give enough statistical information to allow solid judgement to be made
E. g. Typical remote vs mast output Really important • Fit a straight line through the origin (why expect non-zero remote wind when actual wind speed is zero ?) • Number of data points N (affects uncertainties) • Averaging time • Height
Root-mean-square deviation • Is correlation coefficient R2 important? (what will you do with it?) • Are instrument calibration details important? (as long as they are stable) • The important parameter is the most likely size of wind speed error
What does the extra €110k buy you ? A LIDAR has • A smaller (but heavier) box • Quiet operation (but with turbine noise and distance from housing, who cares?) • Marginal increase in R2 (perhaps) • Marginally improved accuracy of wind speed ?? • Increased maintenance costs (probably) • Decreased performance in rain and fog • Higher power consumption • No data below 40m or above 150m • Large height steps (poor vertical resolution)
History and What is Next • Big advance in SODARs in 1980s with multi-speaker/microphone phased-array technology • Big advance in LIDARs in 2000s with fibre-based lasers: directly impacting on wind energy • SODAR developers are only now responding to the impact of LIDARs in wind energy: expectation from new, intense, R&D is another “technology leap”
SNODAR 1m resolution Autonomous operation through Antarctic winter
SONDE Long (several seconds) FM-CW acoustic pulses Huge increase in signal strength (30 dB) Wind speed estimates every few meters, and every few seconds Some remaining technological challenges Current work on real-time tracking of aircraft wing-tip vortices (during landing and take-off)
Triton Similar acoustic design to long-established ASC (AeroVironment) and ART SODARs Solar powered AQ500 Innovative acoustic design (3 dishes, 3 tilted beams, small footprint, reduced diffraction) Generally needs additional baffles New Acoustic Wind Profilers
Where will Improvements be Made? For SODARs: • Clutter (ability to operate near masts etc, quieter) • Smart signals (to give shorter averaging times, lower rms errors) • Lower power • Compact (smaller footprint) • Better operation in rain
Beam design Plot of measured and modelled correlation between winds measured by different beam combinations on the same 5-beam SODAR At 60m, the time taken for air to travel from one beam to another (at the wind speed during these measurements) is equal to the time between acoustic pulses The shape of this curve is a measure of the spatial correlation for wind
Bistatic SODARs 90 40 120 60 30 20 150 30 10 180 0 210 330 240 300 270 Power dB. Blue=velocity fluctuations, Red=temperature fluctuations • Useful to separate transmitter and receiver (‘bistatic’) so that turbulent velocity fluctuations are also measured • The ‘break-even’ angle is about 11: this would require separating the transmitter and receiver by about 20m
“Piccolo” Bi-Static + Smart signals Continuous cycle step-chirp Unfortunately, the direct signal saturated all channels so all useful data is lost during those periods (it needs acoustic baffles) However, beam-forming for z = 32m, picks up the gaps at 0.3s, 0.4s, …,0.9s. Adding resulting power spectra gives 8 dB improvement for SNR of the 3000 Hz signal. This is a very useful increase! 3000Hz 3150Hz 3300Hz 3450Hz 3600Hz 3750Hz 3900Hz 4050Hz 4200Hz 4350Hz Transmitted Received
The Next-Generation SODARs • Will look different (smaller, new acoustic design) • Will be quiet, except when alongside • Will sound different (smart signals) • Will be solar-powered • Will clearly surpass current LIDAR performance
Summary • Next-generation SODARs, with very superior performance will emerge in the next 2-3 years • The design challenges are not extreme • In an increasingly recession and risk-averse financial environment, the business case for SODARs is strong