Download
1 / 43
780 likes | 1.62k Views
Perfusion Imaging S. Lalith Talagala, Ph.D. NIH MRI Research Facility National Institute for Neurological Disorders and Stroke National Institutes of Health, Bethesda, MD. Perfusion Imaging: Outline. Introduction Dynamic Susceptibility Contrast (DSC) Method Quantification Examples

E N D
Perfusion ImagingS. Lalith Talagala, Ph.D.NIH MRI Research FacilityNational Institute for Neurological Disorders and StrokeNational Institutes of Health, Bethesda, MD
Perfusion Imaging: Outline • Introduction • Dynamic Susceptibility Contrast (DSC) Method Quantification Examples • Arterial Spin Labeling (ASL) Method Labeling Techniques Quantification Examples
Definitions Perfusion – capillary blood flow delivered to the tissue MRI methods can assess • blood flow – ml blood / min / 100 g of tissue - • blood volume – ml blood /100 g of tissue • mean transit time – seconds Normal values for brain
Perfusion MRI • Dynamic Susceptibility Contrast (DSC) • Requires contrast injection • Large signal changes, Fast • Single application (clinical) • Arterial Spin Labeling (ASL) • No contrast required • Small signal change, Slow • Multiple measurements (clinical and research)
Imaging Gradient Echo EPI TR ~1.5- 2 s TE = 30 -50 ms ~1.5 min Bolus Injection Gd 0.1 - 0.2 mmol/kg Dynamic Susceptibility Contrast (DSC) Monitor passage of Gadolinium contrast through tissue using rapid T2*/T2 weighted MRI
W/ Gd DSC - Mechanism Gd Chelates: Paramagnetic, Intravascular W/O Gd Tissue/ Blood Dc Field Inhomogeneity R2* (=1/T2*) GE/SE MRI Signal
DSC – Passage of Gd through tissue 1.5 T, 0.1 mmol/kg, GE- EPI, TE = 50 ms, TR = 2 s
DSC – Signal vs Time GM pixel Blood pixel Baseline First pass Recirculation
DSC: Signal loss to Concentration k – proportionality constant C – Gd concentration Sc– Signal with Gd S0 – Baseline signal without Gd
DSC – CBV, CBF, MTT ? F (ml/min) Cart (t) Ctis (t) Tracer Kinetic Theory Arterial input function (AIF) Tissue Response
Cart (t) Ctis (t) Cvein (t) F DSC- Input/Residue/Output Curves 1 R(t) Residue function h(t) Impulse Ä F×Cart(t) Ä F×Cart(t) Cart(t) Typical h”(t) R”(t) INPUT RESIDUE OUTPUT
Tracer Kinetics – Basic Equations h(t) R(t) 1 Frequency function Residue function
DSC- Calculation of CBV Cart (t) Ctis (t)
Cart (t) Ctis (t) Cvein (t) F Rscl(t) CBF DSC- Calculation of CBF and MTT
CBV CBF MTT DSC – CBV, CBF, MTT maps
DSC – CBV, CBF, MTT maps CBV CBF MTT
DSC – CBF maps 1.5 T, 0.1 mmol/kg, GE- EPI, TE = 50 ms, TR = 2 s
DSC: Quantification Issues • Accuracy of DR2* Û C relationship • Arteries (quadratic) and tissue (linear) • Arterial input function (AIF) determination • Partial volume , vessel orientation effects • Truncation of the peak • Dispersion between measurement site and tissue (local AIF) • Deconvolution errors • Sensitivity to noise • Sensitivity to bolus arrival times • Absolute CBF/CBV require use of scaling factors determined separately
Tag Control Label Arterial Spin Labeling (ASL) Measure the change in MRI signal due to magnetic labeling (tagging) of inflowing blood Perfusion Maps => GE/SE EPI TR ~ 2 - 5 s TE = minimum ~ 4-5 minutes LABELING IMAGING 0.5 - 2 s 0.75 s 0.5 – 2.5 s
ASL: Control/Label/Difference Difference (DM) images - S Control 1 pair (10 sec) 24 pairs (4 min) DM: GM – 0.9 %, WM – 0.15 % Label
Cart (t) Ctis (t) Cvein (t) F ASL – One Compartment Kinetic Model R(t) h(t) Impulse Ä F×Cart(t) Ä F×Cart(t) Cont ASL h”(t) R”(t) Pulsed ASL
R1a –relaxation rate of arterial blood a0– labeling efficiency t–labeling time w –post labeling delay l – brain/blood partition coefficient of water ASL- Quantification of CBF One compartment model: Labeled blood stays in the vasculature CASL PASL
ASL: Labeling Strategies CASL • Continuous ASL (CASL) • Narrow labeling plane • Long duration (seconds) • Input function – constant • Pulsed ASL (PASL) • Wide labeling slab • Created by a short pulse (milliseconds) • Input function – decaying exponential (T1 of blood) Labeling Plane PASL Labeling Slab
ASL: Pulsed Labeling (QUIPSS II) Proximal Inversion Proximal Saturation Image … RF/Signal … Gi Gradient Label Gi¹0 Label Voxel View
ASL: Pulsed Labeling (QUIPSS II) Label Gi¹0 Control Gi = 0 Label Voxel View Control
ASL: Pulsed Labeling (Q2TIPS) Control Difference • Disadvantage: • Limited coverage • Advantages: • High tagging efficiency • Low SAR • Ease of implementation
Control RF=0 ASL: Continuous Labeling(Flow-driven Adiabatic Fast Passage) Image Label … RF/Signal Control … Gl Gradient Label Gl¹0 Voxel View Label Control
Continuous ASL: Neck Labeling Coil Labeling Plane 8 Ch Rx • Advantages: • Whole brain coverage • High labeling efficiency • Lower SAR Neck Labeling Coil • Disadvantage: • Requires special hardware
CASL with a Neck Labeling Coil: Multi-shot 3D-FSE Spiral % DS R1 map CBF 3T, Head Coil, 3D-FSE, 3.7 x 3.7 x 5 mm3 8 shots, TR 5.9 s, Label dur 4.1 s, PL delay 1.64 s, Backgr supp 6 min 22 sec Talagala et al, MRM52: 131-140 (2004)
Continuous ASL: Neck Labeling Coil 3T, 8 Ch Rx, 2D EPI, 3 x 3 x 3 mm3, TE/TR 13 ms/5 s, 4.5 minutes
CASL with a Neck Labeling Coil: Hemangioblastomas 3T, 8 Ch Rx, 2D EPI, 1.5 x 1.5 x 3 mm3 TE/TR 16 ms/5 s, LD/PLD 3 s/1.6 s 10 minutes
Volume Tx Coil Surface Labeling Coil Head Rx Array Coil CASL Perfusion MRI at 7 T Tx Volume / 8 Ch Rx Array Neck Labeling Coil
7T CASL with a Neck Labeling Coil Control (RF off) - Label (RF +ve offset) Control (RF off) - Label (RF –ve offset) 7T, 8 Ch Rx, 2D EPI, 2 x 2 x 3 mm3 TE/TR 13 ms/5 s, ASSET X2, LD = 3 s, PLD 1.5 s 8 minutes Talagala et al ISMRM 2008
%DS T1 ms CBF ml/ (100g. min) CASL Perfusion MRI at 7 T 7T, 8Ch Rx, 2.1 x 2.1 x 3 mm3, 9 minutes, n=5
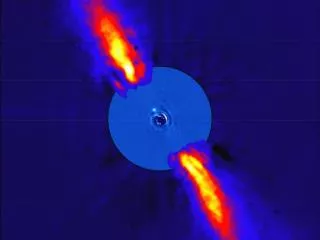
… … Gradient ASL: Pseudo Continuous labeling 0 f 2f 3f nf Image … Label … RF/Signal Control f = gGz t z • Advantages: • Whole brain coverage • High labeling efficiency • Use standard hardware • Disadvantages: • Higher SAR • Labeling sensitive to off-resonance effects 2cm
Pseudo Continuous ASL: 3T data 3T 3.6 x 3.6 x 5 mm3 Gradient-echo EPI TE/TR = 20.8/500 ms t/w = 2500/1700 ms Scan time 5:00
Pseudo Continuous ASL: 7T data 7T 2.3 x 2.3 x 3 mm3 Gradient-echo EPI TE/TR = 20.8/5100 ms t/w = 3000/1200 ms SENSE 3x Scan time 4:15 Luh et al, MRM69:402 (2013)
CASL fMRI with a Neck Labeling Coil 3T, Head Coil Finger movement (0.5 Hz), {48 s Task / 48 Rest} X 6, 10 min GE EPI, 3.75 x 3.75 x 5 mm3 12 s per Cont/Label pair SPM, Spatial normalization smoothing (8 mm), N= 15 Garraux et al, NeuroImage25:122-132 (2005)
3T CASL Perfusion fMRI with 16 Rx 3 x 3 x 3 mm3 CBF 75 ± 11 ml/(min.100g) DCBF 78 ±7% 1.5 x 1.5 x 3 mm3 CBF 92 ± 16 ml/(min.100g) DCBF 102 ± 10% Finger movement (2 Hz), {40 s Rest / 40 Task} X 8, N = 6 GE EPI, TE 26 ms, 10 s per Control/Label pair, 10 min 40 sec
Functional Connectivity with ASL Perfusion DCBF = 29 ± 19% DBOLD = 0.26 ± 0.14% (N=13) 3T, GE EPI, 16 Ch Rx, 3.75 X 3.75 X 3 mm3 TE/TR 12.5/3200 ms, 10 min 40 sec Chuang et al., NeuroImage 40, 1595 (2008)
Functional Connectivity: BOLD, Perfusion, CMRO2 Wu et al., NeuroImage 45, 694 (2009)
Perfusion MRI: Summary • Dynamic Susceptibility Contrast (DSC) • Requires contrast administration • Fast acquisition (< 2 min), whole brain coverage • Readily performed in clinical scanners • Online/Offline processing software available • Absolute quantification is difficult • Arterial Spin Labeling (ASL) • No contrast required • 4-5 min acquisition, whole brain coverage • Absolute quantification is possible • Robust sequences becoming available • Useful for clinical and research work