Download
1 / 39
2.22k likes | 5.17k Views
Stream Flow Measurement/Monitoring . Hydrology and Water Resources RG744 Institute of Space Technology December 11, 2013. Stream flow Measurement. Hydrometry is the science of water measurement It is measurement of flowing water per second (flow rate discharge)

E N D
Stream Flow Measurement/Monitoring Hydrology and Water Resources RG744 Institute of Space Technology December 11, 2013
Stream flow Measurement • Hydrometry is the science of water measurement • It is measurement of flowing water per second (flow rate discharge) • Measurement is required to develop hydrograph, mass curve, for flood warning, distribution of water among users, and determining seasonal variation in runoff • Discharge = area x velocity Q = AV
Two Categories of Measurement • Direct • Area velocity Method • Dilution techniques • Electromagnetic Method • Ultrasonic Method • In-direct • Hydraulic Structures • Slope area method
Measurement of River Stage • Stage is defined as water surface elevation measured above a datum • Continuous measurement of discharge is difficult whereas observation of stage is easy, inexpensive and continuous • Simplest device for this purpose is a staff gage– scale graduated in feet or meters
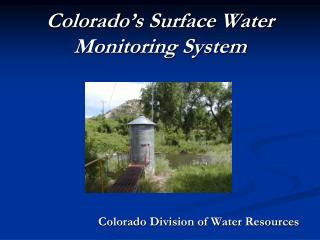
Stream Gaging Station • Float Gage Recorder To record flow depth as a function of time
Stage Data • Often presented as Stage Hydrograph • Depth (stage) vs. time • Discharge hydrograph is not measured directly but inferred from the stage hydrograph
Rating Curve • Relates stage to discharge • Constructed by plotting measured discharge against stage • Typically non-linear curves • Rating Curves can be extrapolated
Stream Flow Velocity • Variation of surface velocity across a river section and at different levels
Vertical Velocity Distribution • In a deep stream subsection, the average velocity is estimated by the average of velocities measured 20% depth (0.2D) and 80% depth (0.8D) • Average velocity for flow in a shallow subsection of a river is observed to be equivalent to the actual velocity measured at 0.6h depth from surface of water
Isovels • Isovels: lines joining the points having equal velocity
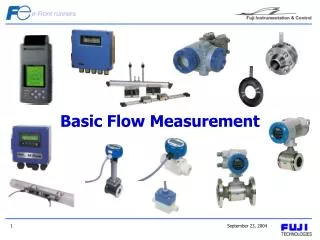
Measurement of Velocity • Current meters (mechanical device) • To measure the velocity at a point in the flow cross-section • Rotates by the stream current with an angular velocity proportional to the stream velocity v = aNs + b • Floats • Floating object on the surface of a stream • Measure distance ‘S’ it travels in time ‘t’ • Surface velocity ‘V’ can be calculated using the relation: V = S/t • Mean velocity can be determined by multiplying the surface velocity with a reduction coefficient
Area- Velocity Method • Involves measuring • area of cross-section of a river at various sites called gaging sites • velocity of flow through the cross-sectional area (by current meters or floats)
Calculating x-section area • X-section area = depth at the ith segment * (1/2 width to the left + ½ width to the right) • Stream Cross-section
Area- Velocity Method • Calculation of Discharge For 1st and last segment
Dilution Technique • Also known as chemical method • Depends on continuity principle applied to a tracer that’s allowed to mix completely with the flow • Co = Initial tracer concentration (background concentration) • C1 = added concentration of tracer at section 1 • C2= tracer concentration at section 2 downstream • Q1= tracer injection rate • Q= Stream discharge
Electromagnetic Method • Based on Faraday’s principle • Large coil buried at the bottom of the channel carrying current I that produces a magnetic field • Small voltage produced due to the flow of water is measured by electrodes • Signal output E (millivolts) is found to be related to discharge Q as:
Ultrasonic Method • Basically area-velocity method • Average velocity is measured using ultrasonic signals • Transducers or sensors are used to send and receive ultrasonic signals
Ultrasonic Method • Transducer A sends an ultrasonic signal received at B and B sends a signal that’s received at A after elapse time t1 and t2 respectively, then t1 = L/(C + vp) t2 = L/(C – vp) Where: L = Length of path from A to B C = Velocity of sound in water vp = component of the flow velocity in the sound path = vcosθ v = average velocity at a height ‘h’ above the bed
Indirect Methods of Stream Flow Measurement • Use the relationship between the flow discharge and depths at specified locations • Depths are measured in the field • Two broad classifications: • Hydraulic Structures (weirs and flumes) • Slope area method
Hydraulic Structures for Stream Flow Measurement • These structures produce a unique control section in the flow • At these structure discharge Q is a function of water surface elevation h at measured at a specified upstream location Q = f (h) (equation A)
Types of Hydraulic Structures • Weirs • 90 degree V-notch weir • Sharp crested rectangular weir • Sharp crested trapezoidal (Cipolletti) weir • Flumes • Parshall Flume • Rectangular Flume • Trapezoidal Flume • U Flume
Weir • Weirs are structures which are inserted in the channel to measure flow • Depth or "head" of the water is measured as water flows over a weir • For weirs equation A becomes Q = K (h)n • H = Head over the weir • K and n = system constants depending on the geometry of the weir
90 degree V-Notch Weir Q = 2.49 (h) 2.48 Where: Q = flow in cubic feet per second h = head (depth of flow) above the notch invert (lowest point) in feet
Sharp-Crested Rectangular Weir Q = CwLh3/2 where: Q = flow h = head (depth of flow) above the weir Crest L = length of weir crest Cw = weir coefficient
Flume • Used for small stream flow measurements • Device formed by constriction in the channel (narrowing in a channel or/and hump) • Head is measured in the flume upstream of the throat • When manufactured and installed according to the specification rating can be taken directly from published tables
Slope-Area Method • Indirect determination of flood discharge • Consists of estimating 3 basic factors • Area of average x-section in a longitudinal reach of channel of known length • Slope of the water surface in the same reach • Roughness of the streambed • If the channel cross-section, slope, and roughness are known, flow can be estimated by: • Manning Equation or • Chezy Equation
Manning: V = R2/3 s1/2n Chezy: V = C R1/2 s1/2 also C = R1/6 n Q = VA Where: V = mean flow velocity R = Hydraulic Radius (cross-sectional area divided by the wetted perimeter) s = slope of the channel n = Manning roughness coefficient of the channel C = Chezy roughness coefficient Q = volumetric flow A = cross-sectional area
Example 6.7:Nancy D. Gordon Calculate the discharge through a section where the stream has overflowed onto the floodplain and the dimensions of the water area as shown. For both sub-sections, S=0.005. In sub-section 1 n= 0.06 and in 2 n = 0.035.