Download
1 / 46
500 likes | 663 Views
Biogeographic regions. Sclater Wallace Sclater-Wallace System. Why might birds be less useful than other taxonomic groups when determining biogeographic regions?. Biogeographic regions. 1. Nearctic—N. America including about 2/3 of Mexico and Greenland

E N D
Biogeographic regions • Sclater • Wallace • Sclater-Wallace System
Why might birds be less useful than other taxonomic groups when determining biogeographic regions?
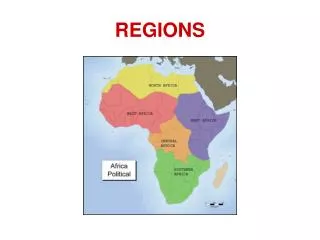
Biogeographic regions • 1. Nearctic—N. America including about 2/3 of Mexico and Greenland • 2. Palearctic—Europe, northern Africa, and northern Asia--Nearctic and the Palearctic make up the Holarctic • 3. Neotropical—lower 1/3 of Mexico, Central and South America • 4. Ethiopian or African—Sub-Saharan Africa, adjacent Arabian Peninsula • 5. Oriental—Indian subcontinent and adjacent regions of southern Asia • 6. Australian—Includes Australia, Tasmania, New Guinea, and New Zealand.
Wallace’s line—demarcation of boundary between the Oriental and Australian biogeographic regions
Biogeographic boundaries between the Palearctic and the Ethiopian regions and the Nearctic and Neotropical are similarly difficult to locate
Important factors that have lead to distinctive biogeographic regions • Present biogeographic barriers • Plate tectonics • Evolutionary history of families
Present barriers influence the numbers and types of organisms that can disperse between regions • Deserts, for example the Sahara and the Sonoran
Present barriers • Bodies of water, for example the oceans, the Bering Strait, water channels in the Malay archipelago
Present barriers • Mountain ranges like the Himalayas
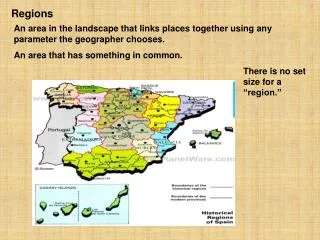
Geographic range--area where a species (or higher taxonomic group) is located
Types of range maps • Dot maps • Outline maps • Contour maps
How do biologists determine if a species inhabits a region? • Visual surveys • Vocalization surveys • Trapping organisms • Fecal pellets • Tracks • Other animal-related signs
Historical ranges? • Museum records • Publications
Terms • Size of a population • Abundance of individuals • Density of a population
Sampling Act, process, or technique of selecting a representative part of a population (or location) for the purpose of determining parameters or characteristics of the whole population (or all locations).
Random sampling Key is that each individual (or location) in the population (or area) have an equal chance of being sampled.
Without random sampling, individuals (or locations) measured are not representative of the whole population (or area) but of only a part of the population (or area). For example, if one samples only along roads, and roads tend to be poor-quality habitat, density estimates may not reflect density in higher-quality habitats
Sometimes poor-quality habitat will have higher densities than higher-quality habitat and sometimes lower • Individuals in poor-quality habitat may weigh less (be in worse condition) than individuals in higher-quality habitat
So, non-random sampling may bias your results. • Bias is the systematic distortion of a statistic (like population abundance) because of sampling technique • The direction of the bias depends on the variable you are interested in (density, weight) and the organisms/system you are studying.
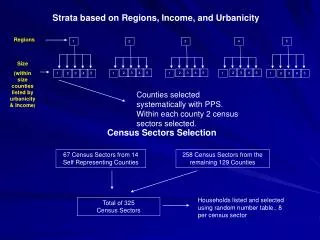
Stratified random sampling The study population (or area) is divided into nonoverlapping strata or areas, and samples are selected from each stratum or area independently
Think carefully about the question before designing a study. If you want a relatively unbiased estimate of the density of deer in Michigan’s LP, consider stratified random sampling over the whole LP. If you want to compare densities of deer in coniferous and deciduous woodlands, then sample is those two habitat types.
To determine density of individuals per unit area • Frequency of abundance along transects or in quadrats • Trapping organisms • Counting fecal pellets • Vocalization frequencies • Percentage ground cover
Other techniques • Pelt records • Catch-per unit effort • Feeding damage • Visual counts of organisms in a standardized method
Examples • Desert tortoises • Freshwater mussels
Sampling problems • Individuals at low density • Reduced activity during drought conditions • Often in underground burrows • Young are very hard to find • Inter-observer differences in sampling
Sampling scheme • Two 1 mile squared plots searched • One plot searched 5 times, one 2 times • Observers walked slowly through plots, on parallel transects, and marked encountered tortoises • About 70 person days required to sample each plot
Plot 1—each new tortoise detected required 10.4 hours of searching • Plot 2—each new tortoise detected required 12.6 hours of searching
Investigators used computer simulations to determine whether population size estimates from 1 mile squared plots, 1 km squared plots, and 0.25 km squared plots, were reasonable, that is, did they have small variance? • Population estimates must be made from data because data do not represent actual numbers of tortoises
Simulations showed that estimates from 1-km squared plots were similar to those from 1-mi squared plots. Estimates from 0.25km squared plots were overestimates. • All estimates had high levels of variability • Plot 1 estimate—43.24 tortoises/km2 ± 4.40 (37-54 Confidence Interval) • Plot 2 estimate—35.52 tortoises/km2 ± 5.02 (28-48 Confidence Interval)
Conclusions • Current sampling methods are inadequate • Much more effort should be expended to find adequate numbers of tortoises to adequately estimate population densities with smaller confidence intervals
Other issues • Did not use random sampling of locations so population estimates are specific to the sites where they sampled
Impetus for study • Zebra mussel infestation has led to declines of native mussels in many areas
Lake St. Clair • Maximum natural depth—6.5 m • Muddy sand at bottom of middle of lake • Gravel and sand at bottom near shore of lake
Random sampling not used • 90 sites sampled • Sampling techniques used: 1m2 quadrats with divers using SCUBA Ekman grabs from boats Sampling by divers in concentric circles around detected native mussels
Native mussels not found in western sites • 22 species found at 33 sites in eastern sites • Freshwater mussels detected in shallow waters with firm (gravel/sand) substrates and in marshy bays with soft muddey substrates
Zebra mussels may not like shallow waters with greater wave action
Issues with study • Without random sampling, results can’t be applied to whole lake or other lakes in area • The results can suggest patterns that investigators can study further.
Center vs. periphery of geographic ranges • Environmental conditions assumed to be better at center than periphery of a species’ range
General patterns • Populations denser (less isolated) within range center • Populations less variable in size over time within range center • Populations have greater genetic diversity within range center
It has been expected that peripheral populations are more susceptible to extinction than central populations because • Small size makes them susceptible to demographic stochasticity • Less likely to experience rescue effect • More susceptible to genetic drift • Less raw material for natural selection
Rescue effect • Individuals from large, source populations sometimes disperse to smaller, more isolated populations and so “rescue” those populations from extinction
However, range collapse often occurs at center, not periphery of range • Giant panda • Red wolf • Black-footed ferret • California condor • American burying beetle • Several Australian mammals
Contagion hypothesis • Contagions (anthropogenic disturbances) impact most isolated populations last
Examples of contagions • Habitat degradation • Introduced species • Contamination • Xerification
Is periphery of range better place for species’ re-introductions? • Benefits • Costs