Download
1 / 3
30 likes | 121 Views
Strata based on Regions, Income, and Urbanicity. Regions. 1. 2. 3. 4. 5. Size (within size counties listed by urbanicity & Income ). 2. 3. 4. 5. 2. 3. 4. 5. 2. 3. 4. 5. 1. 1. 1. 1. 1. 2. 3. 4. 5. 2. 3. 4. 5.

E N D
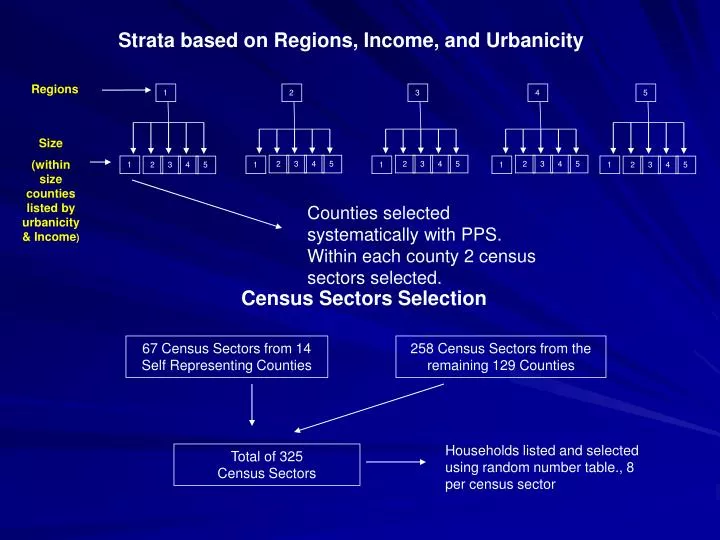
Strata based on Regions, Income, and Urbanicity Regions 1 2 3 4 5 Size (within size counties listed by urbanicity & Income) 2 3 4 5 2 3 4 5 2 3 4 5 1 1 1 1 1 2 3 4 5 2 3 4 5 Counties selected systematically with PPS. Within each county 2 census sectors selected. Census Sectors Selection 67 Census Sectors from 14 Self Representing Counties 258 Census Sectors from the remaining 129 Counties Households listed and selected using random number table., 8 per census sector Total of 325 Census Sectors
Brazilian Sampling Structure • Sample size N=2,600 (<=18yrs) & 400 (14 -17 yrs) • We need (2,600 / 8) = 325 Census Sectors (CS) • Total no. of Counties = 163 • 14 Counties are Self Representing = 67 CS • We need 258 CS = (325-67) OR 129 counties 2 CS per county • 8 Interviews per CS* 2 Sectors in a county = 16 Interviews per county
Total number of Strata = 25+14 SR counties= 39 • Total number of PSUs (which are your sectors) = 196 • (258/2) + 67 = 129+67=196 PSUs • One PSU equivalent = 1,08 mill