Download
1 / 19
190 likes | 217 Views
The i-sim model provides a detailed simulation of the impact of EU accession on Hungarian agriculture. It includes data on activity levels, gross production, revenue, consumption, and trade dynamics. The model analyzes various scenarios and results from the base and reference runs in 2006, considering exogenous parameters, political variables, yield estimates, market prices, and inflation rates. The simulation examines sectoral income, production structure changes, quota effects on milk production, direct payments, EU market pressure on pork and poultry, and implications for Hungarian agriculture post-accession. Recommendations include addressing quotas, maximizing flexibility in measures, forming political alliances, utilizing national envelopes for structural changes, and exploring rural development opportunities to counter EU-15 competition. Explore the model's core equations for a comprehensive understanding of policy implications in Hungarian agriculture.

E N D
i-sim HU i-sim CZ i-sim PL Idara Policy Simulation Model (i-sim) i-sim Simulating Policy Effects of EU Accession on Hungarian Agriculture
i-sim HU i-sim CZ i-sim PL Model Characteristics • i-sim • Sector Model • Partial Equilibrium • Comparative-Static- Elasticity driven
Modelling Procedure • Consistent Data Base • Base Year Reproduction • Reference Run (Base Line) • Scenario Runs
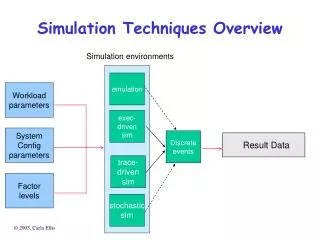
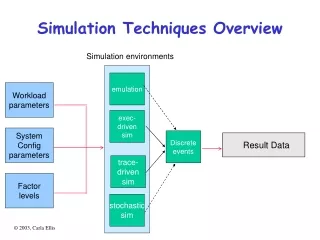
Results Reference Run 2006 Activity Level Gross Production Activity Revenue Consumption Net Trade i-sim Reference Run Exogenous Parameters Political Variables Base Year Yield Estimates for 2006 World Market Prices for 2006 Inflation Rate 98-06 i-sim Data Base A3 1998 Exchange Rate Estimate 2006 Behavioural Equations Base Year 1998 Elasticity Matrix ei,j
Exogenous Parameters Political Variables Base Year Yield Estimates for 2006 Results Scenario Run 2006 World Market Prices for 2006 Inflation Rate 98-06 Exchange Rate Estimate 2006 i-sim Simulation Run i-sim Data Base A3 1998 Activity Level Behavioural Equations Gross Production Activity Revenue Consumption Net Trade Base Year 1998 Elasticity Matrix ei,j
Results Scenario Run 2006 Results Reference Run 2006 Activity Level Gross Production Activity Revenue Consumption Activity Level Net Trade Gross Production Activity Revenue Consumption Net Trade i-sim Scenario Analysis X%
i-sim Scenario ResultsSectoral Income • Production Value and Gross Value Added increased after accession • Model shows not much differences in plant and general inputs, but higher fodder input in CEEC scenario • Highest GVAM in CEEC scenario mainly caused by quota level (milk,sugb)
i-sim Scenario ResultsProduction Structure I Share of animal production on Agricultural Production Value will increase in 1SHU most, because of restrictive milk quotas and lower premia for cattle
i-sim Scenario ResultsProduction Structure II Only very limited changes in Land allocation between Scenarios: Slight increase in Cereals and Oilseeds due to Direct Payments Drastic Changes in Animal Production: - CAP favours Beef and Milk Production - Higher price level and quotas set incentives for Dairy Production - High market pressure on Pork and Poultry Production (lower EU price level) and removal of national subsidies
i-sim Scenario ResultsQuota Effects: MILK Rising yields in combination with Quota restriction leads to lower Activity Level than without quotas Gross Production is determined by Quota, binding restriction!
i-sim Scenario ResultsQuota Effects: MILK Revenues (EURO/hd) rise in both scenarios relative to the reference situation (no accession), but due to quota restriction, activity levels and gross production go down in 1SHU (EU proposal)
i-sim Scenario ResultsDirect Payments: Soft Wheat • Revenues and Production value rise due to Premia and higher EU price level • Revenues are higher than in reference situation for all scenarios • Activity levels remain almost unchanged due to higher revenue increases in other crop activites (Oilseeds)
i-sim Scenario ResultsEU Market Pressure: Pork Pork production is reduced due to internal market pressure (low EU-15 Prices) No differences between the scenarios
i-sim Scenario ResultsEU Market Pressure: Poultry Market pressure on poultry production not as drastic as on pork Activity level increases around 5% compared with reference
Conclusions from a Hungarian Perspective • Sectoral income is rising after accession • Production structure changes mostly for the animal activities away from pork and poultry to milk and beef • Production Activities that gain from accession: Beef, milk (revenues only), cereals, oil seeds, potatoes, sugar beet (revenues only) • Production Activities that get under pressure after accession: Pork, (poultry) • Quotas significantly hinder competitiveness and necessary structural changes • For the products with the sharpest market pressure there are no direct payments (Pork, poultry) • Compromise proposal achieves similar level of production with lower costs to EU Budget => advantage for negotiations
Policy Implications Short Term (Negotiations) • Quotas and ceilings are more important than Direct Payments • Maximise flexibility in measures so that competitiveness and structural change can be improved/supported • Think cross-sectoral, since serious welfare effects on other sectors if allocation is misdirected. Mid Term (Post-Accession) • Form political alliance to abandon quotas • Use national envelopes for policies that support structural changes • Use rural development measures to increase alternative employment opportunities • Pressure on agriculture will rise with quality competition from EU-15 • Further investigate regional effects
Core Equations PW = World Market Price PTE = Domestic Market Price POLP = Political Variables per Product PP = Producer Price M = Fixed Processing Margin REV = Revenues YLD = Yields LVL = Activity Levels POLA = Pol. Var / Activtiy PI = Input Prices PRD = Gross Production INP = Demand for Inputs (Feed and non Feed) LNK = Uses linked to production
Input Demand (non feed) INP = Input Demand SPI = Input demand shifter REVS = Revenues IREV = Input elasticities wrt Activity Revenues PP =Producer Prices IP = Input elasticities wrt own prices PP = Producer Price PACT = Production Activity
Input Demand (feed) INP = Input Demand SPI = Input demand shifter REVS = Revenues FLVL = Feed elasticities wrt Activity Revenues PP =Producer Prices FP = feed elasticities wrt own prices PP = Producer Price PACT = Production Activity