Download
1 / 73
730 likes | 733 Views
Regression Continued: Functional Form. LIR 832. Topics for the Evening. Qualitative Variables Non-linear Estimation. Functional Form. Not all relations among variables are linear: Our basic linear model: y= b 0 + b 1 X 1 + b 2 X 2 +…+ b k X k + e. Functional Form.

E N D
Topics for the Evening • Qualitative Variables • Non-linear Estimation
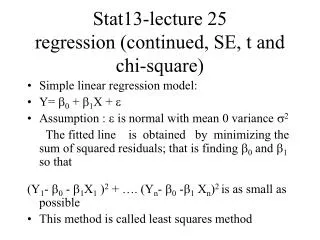
Functional Form • Not all relations among variables are linear: • Our basic linear model: y=b0+ b1X1 + b2X2 +…+ bkXk + e
Functional Form • Q: Given that we are using OLS, can we mimic these non-linear forms? • A: We have a small bag of tricks which we can use with OLS.
Functional Form • A first point about functional form: You must have an intercept. • Consider the following case: We estimate a model and test the intercept to determine if it is significantly different than zero. We are not able to reject the null in a hypothesis test and we decide to re-estimate the model without an intercept. What is really going on? • Return to our basic model: y=b0+ b1X1 + b2X2 +…+ bkXk + e • What are we doing when we remove the intercept? y=0+ b1X1 + b2X2 +…+ bkXk + e
Functional Form /* Regression without an intercept */ Regression Analysis: weekearn versus years ed The regression equation is weekearn = 57.3 years ed 47576 cases used, 7582 cases contain missing values Predictor Coef SE Coef T P Noconstant years ed 57.3005 0.1541 371.96 0.000 S = 534.450
Functional Form /* Regression with an intercept */ Regression Analysis: weekearn versus years ed The regression equation is weekearn = - 485 + 87.5 years ed 47576 cases used, 7582 cases contain missing values Predictor Coef SE Coef T P Constant -484.57 18.18 -26.65 0.000 years ed 87.492 1.143 76.54 0.000 S = 530.510 R-Sq = 11.0% R-Sq(adj) = 11.0%
Functional Form • Consequences of forcing through zero: • Unless the intercept is really zero, we are going to bias both the intercept and the slope coefficients. • Remember that we calculate the intercept so that the line passes through the point of means: • Assures that the Σε = 0 • If we impose 0 as the intercept, the line may not pass through the point of means and the sum of the errors may not equal zero. • Biases the coefficients and leads to incorrect estimates of the standard errors of the βs. • Never suppress the intercept, even if your theory suggests that it is not necessary.
Functional Form /* What About Those Residuals? */ Descriptive Statistics: RESI1, RESI2 Variable N N* Mean SE Mean StDev Minimum Q1 Median RESI1 47576 7582 -8.67 2.45 534.38 -1180.31 -359.12 -122.21 RESI2 47576 7582 0.00 2.43 530.50 -1329.77 -340.32 -107.62 Variable Q3 Maximum RESI1 218.59 2311.61 RESI2 237.69 2494.26
Functional Form • Returning to the issue of non-linearity… • In our basic model: • b = DY/DX = change in Y for a one-unit change in X • Consider the effect of Education on base salary…
Functional Form Descriptive Statistics: years ed, Exp Variable N N* Mean SE Mean StDev Minimum Q1 Median Q3 Maximum years ed 55158 0 15.734 0.00941 2.211 1.000 14.000 16.000 18.000 21.000 Exp 55107 51 21.644 0.0496 11.640 0.0000 13.000 22.000 30.000 76.000 Regression Analysis: weekearn versus years ed The regression equation is weekearn = - 485 + 87.5 years ed 47576 cases used, 7582 cases contain missing values Predictor Coef SE Coef T P Constant -484.57 18.18 -26.65 0.000 years ed 87.492 1.143 76.54 0.000 S = 530.510 R-Sq = 11.0% R-Sq(adj) = 11.0%
Functional Form • Now create a graph in MINITAB: • Work in a new worksheet: • Create values for years of education 0 - 21 • Use the calculator to create the predicted weekly earnings. • Use the scatterplot graphing function:
Functional Form Every year of education increases earnings by $87.49!
Functional Form • Q: How do we estimate non-linear relations? • A: We can use log transforms of variables to measure relations between variables as percentages rather than units. • What is a log? What is a log transform? • Take any number, let’s take 10. • Then calculate b such that 10 = 2.71828b. Then b is the log of 10. In this case b = 2.302585. • You can do this on your calculator, in a spreadsheet, or in MINITAB.
Functional Form • As your text shows: • ln(100) = 4.605 100 = 2.71828b • ln(1000) = 6.908 1000 = 2.71828b • ln(10,000) = 9.210 10,000 = 2.71828b • ln(1,000,000) = 13.816 1,000,000 = 2.71828b • We typically do not write 2.71828, rather we substitute e the natural base (there are also base 10 logs). So… • 10 = e2.302585 • Some nice properties of log functions: • ln(X*Y) = ln(X) + ln(Y) • ln(X2) = 2*ln(X)
Functional Form • This property made it possible to manipulate very large numbers very easily and provides the foundation for slide rules and many modern computer calculations. • Consider: 1,212,345*375,282 • A real mess to do by hand • Now consider the following transformation of this problem: • ln(1,212,345*375,282) • =ln(1,212,345) + ln(375,282) • =14.008067 + 12.83543 • = 26.8435 • = 2.7182826.8435 • = antilog(26.8435) • = 45,484,956.5078803
Functional Form • The Shell presentation has an equation associated with an upward curve of: • Earnings = 62988x0.2676 • Or… y=b0Xb1 • We cannot estimate this in its current form using regression, but think about taking the log of each side: • ln(y) = ln(b0Xb1) • ln(y) = ln(b0)+ln(Xb1) • ln(y) = ln(b0)+b1ln(X) • So, if we take the log of each side, we get a linear equation that we can estimate!
Functional Form • Consider the following equation: (single log equation) • ln(weekearn) = b0 + b1*YearsEd + e • The interpretation of the coefficient on years of education is now the % change in base salary for a 1 year change in Education. • How to do this in MINITAB: • Calculate the log of weekly earnings • Estimate the regression as…
Functional Form Regression Analysis: ln week earn versus years ed The regression equation is ln week earn = 4.87 + 0.109 years ed 47576 cases used, 7582 cases contain missing values Predictor Coef SE Coef T P Constant 4.86646 0.02382 204.33 0.000 years ed 0.108980 0.001497 72.78 0.000 S = 0.694967 R-Sq = 10.0% R-Sq(adj) = 10.0% Analysis of Variance Source DF SS MS F P Regression 1 2558.4 2558.4 5297.03 0.000 Residual Error 47574 22977.3 0.5 Total 47575 25535.6
Functional Form • Now we find that an additional year of education results in a 10.98% increase in salary. • Interpretation is different from linear model • r2 is different between linear and log model. • Linear: r2 =11.0% • Log: r2 = 10.0% • Does this mean the fit of the log model is worse than the linear model? • No, cannot compare the two because you have transformed the equation. Fundamentally altered the variance of the dependent variable.
Functional Form Descriptive Statistics: weekearn, ln week earn Variable N N* Mean SE Mean StDev Minimum Q1 Median weekearn 47576 7582 894.53 2.58 562.22 0.01 519.00 769.23 ln week earn 47576 7582 6.5843 0.00336 0.7326 -4.6052 6.2519 6.6454 Variable Q3 Maximum weekearn 1153.00 2884.61 ln week earn 7.0501 7.967 • What Does the Log Model Look Like? -- How to create a prediction in MINITAB & graph: • Use regression equation to create estimated log wage from years of education data • Exponentiate the predicted value using the MINITAB calculator • Graph predicted wage against years of education
Functional Form • What is the equation underlying this model? • Model of growth (such as compound interest)…
Functional Form • Now lets try another approach, taking the log of both sides (double log equation): • The interpretation of the coefficient on JEP is now the % change in base salary for a 1 % change in JEP. • Note that this is an elasticity (which you will discuss in 809 in talking about supply and demand – the elasticity of labor demand with respect to the wage is the % change in the demand for labor for a 1% change in the wage).
Functional Form Regression Analysis: ln week earn versus ln ed The regression equation is ln week earn = 2.13 + 1.62 ln ed 47576 cases used, 7582 cases contain missing values Predictor Coef SE Coef T P Constant 2.12844 0.06203 34.32 0.000 ln ed 1.62142 0.02254 71.93 0.000 S = 0.695775 R-Sq = 9.8% R-Sq(adj) = 9.8%
Functional Form • What is going on graphically? What are we really doing?
Functional Form • Q: How do we choose? • A: Prior work and theory • Is it sensible to measure as a linear model, or does one of these non-linear forms make better sense? • Example: • Thinking of the relationship between education and wages: • wage = β0 + β1*Years_of_Education • ln(wage) = β0 + β1*Years_of_Education • ln(wage) = β0 + β1*ln(Years_of_Education)
Functional Form • What does prior work indicate? • We typically use a log wage equation rather than a wage equation because… • Turns out the error term is normally distributed in a log wage equation. • More readily compared across models as it is not dependent on the scaling of the variable. • Comparing the effect of education in percentage terms frees us from the effect of inflation and alternative currencies.
Functional Form • A more general non-linear form (The Polynomial Form) • Problem: Do we really believe that you get an additional 0.723% in weekly earnings for each year you get older. Hardly makes it worth getting older.
Functional Form Regression Analysis: ln(wkern) versus age, gender, edattain The regression equation is ln(wkern) = 2.41 + 0.00723 age - 0.368 gender + 0.105 edattain 47576 cases used 7582 cases contain missing values Predictor Coef SE Coef T P Constant 2.41075 0.06470 37.26 0.000 age 0.0072344 0.0002669 27.11 0.000 gender -0.368278 0.006115 -60.22 0.000 edattain 0.105032 0.001491 70.45 0.000 S = 0.6626 R-Sq = 18.2% R-Sq(adj) = 18.2% This model remains linear in ln(weekly earnings), each unit increase in age causes earnings to rise by 0.7%.
Functional Form • It would be more reasonable to believe we will get a relationship which looks like: Why?
Functional Form • How do we mimic this? Consider estimating the following linear regression: • Notice that age enters twice, first as a linear term and then as a square. What does this model look like with real data?
Functional Form Regression Analysis: ln(wkern) versus age, age2, gender, edattain The regression equation is ln(wkern) = 0.927 + 0.104 age - 0.00113 age2 - 0.376 gender + 0.0948 edattain 47576 cases used 7582 cases contain missing values Predictor Coef SE Coef T P Constant 0.92706 0.06640 13.96 0.000 age 0.103919 0.001547 67.17 0.000 age2 -0.00112565 0.00001776 -63.37 0.000 gender -0.376012 0.005874 -64.01 0.000 edattain 0.094822 0.001441 65.82 0.000 S = 0.6363 R-Sq = 24.6% R-Sq(adj) = 24.6%
Functional Form • Note that we now have two coefficients on Age: • Age .103919 • Age2 -0.00112565 • We know that the first term indicates that for each additional year our weekly earnings rise by 10.39%. But how do we chart out the second term. so that we have the full effect of age on earnings?
Functional Form • The effect of an additional year on earnings (formula for a polynomial model): • If our model is: y = b0 + b1X + b2X2 + …. • Then DY/DX = b1+2*b2*X • First issue, look at the prediction of ln weekly earnings based on age (leave all other variables at their mean).
Functional Form • What about the ‘marginal effect’ of age? • What is the effect on income of getting an additional year older? • Obviously varies with how old you are. Things are pretty good when you are young • Two ways of obtaining this: • 1. Calculate the difference in the total effect of age for any two years. • Age22 1.741 • Age21 1.686 • Diff 0.055 or + 5.5%
Functional Form • 2. Alternatively, use the polynomial formula:
Functional Form • What is the increase in earnings at age 21? • .103919 - .0022513*21 =0.056642 • What about age 25? • .103919 - .0022513*25 =0.0476365 • What about age 50? (Class work) • Note that the effect of an additional year of education is no longer constant, it depends on how old you are.