Download
1 / 10
120 likes | 130 Views
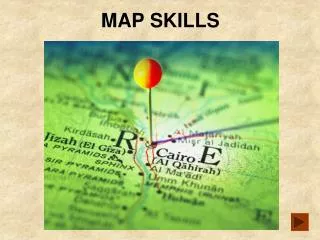
MAP Skills. The World’s Geography. Geography. Scientists study the land and water that cover Earth. They also study how people live on Earth. The study of Earth and its people is called geography. CONTINENTS.

E N D
MAP Skills The World’s Geography
Geography • Scientists study the land and water that cover Earth. • They also study how people live on Earth. • The study of Earth and its people is called geography .
CONTINENTS • Earth is divided into seven large landmasses called continents . You can see the continents on the map below. From largest to smallest, the continents are Asia, Africa, North America, South America, Antarctica, Europe, and Australia.
MAPS&GLOBES • Geographers use maps and globes to measure and describe Earth. • We use maps to see natural and human-made features and to understand patterns. • Maps have changed over time to reflect people's increasing understanding of the world. • Globes • One advantage of a globe is that it looks more like Earth, since both are round. A globe shows the viewer exactly how continents and oceans appear on Earth's curved surface. A globe also shows the true shapes, locations, and relative sizes of Earth's landforms and bodies of water.
Maps • A map, on the other hand, is a flat representation of Earth's surface. It can be drawn to any size. No flat map can ever be as accurate as a globe. • That is because Earth's surface is distorted somewhat when it is flattened to create a map. In other words, a map can alter how Earth really looks.
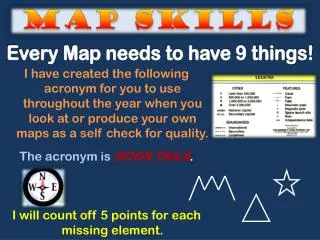
Reading Maps Most maps have nine features, as shown in the map above. These features, described below, help you read and understand maps. • Title: The title tells the subject of the map and gives you an idea of what information is shown. • Compass rose: The compass rose shows directions: north, south, east, and west. • Symbols: Symbols represent such items as capital cities and natural resources. The map legend explains what the symbols mean.
Reading Maps • Legend: The legend, or key, lists and explains the symbols and colors used on the map. • Lines of longitude: These are imaginary lines that measure distances east and west of the prime meridian. • Lines of latitude: These are imaginary lines that measure distances north and south of the equator. • Scale: A scale can be used to figure out the distance between two locations on a map. • Labels: Labels indicate the names of cities, landforms, and bodies of water. • Colors: Colors represent a variety of information on a map. The map legend explains what the colors mean.
Types of Maps • Political Maps Political Maps Political maps show the features people have created, such as cities, states, provinces, territories, and countries. State and country boundaries can also be outlined on these types of maps. A political map of a smaller area, such as a state, often shows county boundaries. Here are some of the questions the features of a political map, like the one below, might help you answer: • Where on Earth's surface is this area located? • What is the size and shape of the area? How might its size or shape affect its people? • Who are the area's neighbors? • How populated does the area seem to be?
TYPES OF MAPS • Physical MapsOn a physical map, you can see what Earth's surface might look like from space. Physical maps show the landforms and bodies of water found areas. Colors are often used to show elevations. On the map above, for example, brown indicates higher, more mountainous areas. Green shows areas that are relatively flat. Political and physical features are often shown on one map. When this information is combined, you can use it to help you better understand the region. For instance, find the cities shown on the physical map of Brazil above. Notice that many of these cities are located near the coast. Like political maps, physical maps can help you understand specific characteristics of places. Here are some questions the features of a physical map might help you answer: •Are there mountains or plateaus in the area?•Near what physical features do most people live?•What is the area's range of elevation? How might higher and lower elevations affect people's lives?•In which direction do the rivers flow? How might this affect travel and transportation in the area?
TYPES OF MAPS • Thematic MapsA thematic map includes certain information about a place or region. For example, the thematic map on this page shows the climates in Brazil. Thematic maps can use colors, symbols, lines, or dots to help you see patterns. The map's title and legend will help you understand the theme and the information presented. In this textbook, you will find thematic maps on such topics as historical events, vegetation, and population density. In fact, a thematic map can show just about any kind of information you can imagine. Here are just a few of the questions different thematic maps can help you answer: • Where in the world do people speak Spanish? • What are the natural resources of Africa? • What is the best route for sailing across the Atlantic? • Where and when did key battles take place during World War II? • Where were the major trade routes in Asia in ancient times? • Which type of map might help you find the highest mountain in Brazil?