Download
1 / 89
900 likes | 1.14k Views
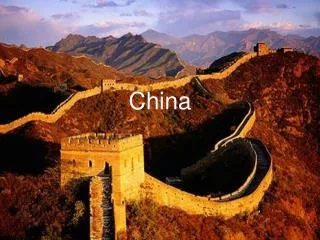
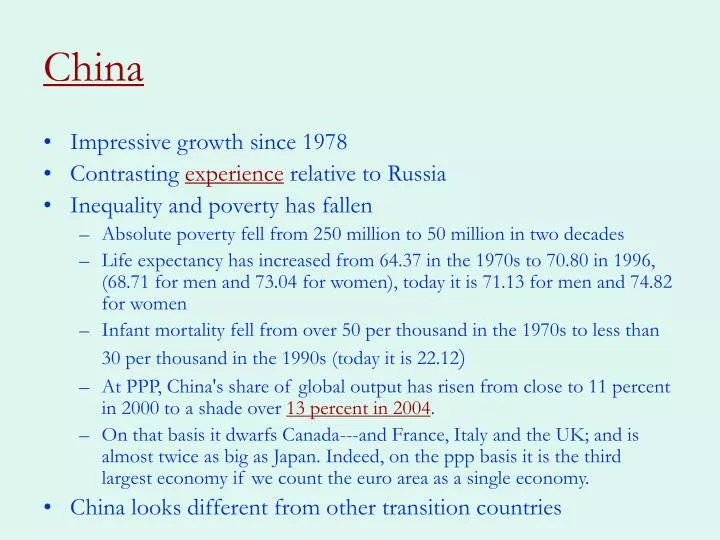
China. Impressive growth since 1978 Contrasting experience relative to Russia Inequality and poverty has fallen Absolute poverty fell from 250 million to 50 million in two decades

E N D
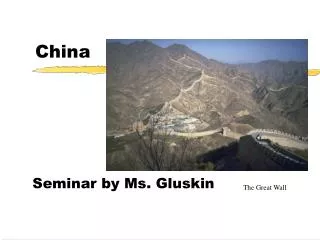
China • Impressive growth since 1978 • Contrasting experience relative to Russia • Inequality and poverty has fallen • Absolute poverty fell from 250 million to 50 million in two decades • Life expectancy has increased from 64.37 in the 1970s to 70.80 in 1996, (68.71 for men and 73.04 for women), today it is 71.13 for men and 74.82 for women • Infant mortality fell from over 50 per thousand in the 1970s to less than 30 per thousand in the 1990s (today it is 22.12) • At PPP, China's share of global output has risen from close to 11 percent in 2000 to a shade over 13 percent in 2004. • On that basis it dwarfs Canada---and France, Italy and the UK; and is almost twice as big as Japan. Indeed, on the ppp basis it is the third largest economy if we count the euro area as a single economy. • China looks different from other transition countries
Brief Background • Soviet Advisers • Great Leap Forward • Cultural Revolution • Household Responsibility System
Collective Farms • end-1955 = 500 advanced cooperatives, • by 1957 there were 700,000 cooperatives, with 119 million members. • Early collectivization was successful: from 1952-1958 gross output rose by 27.8% while population rose by 14.8%. • In 1958 cooperatives were amalgamated into the Peoples communes, about 24,000. • Prior to 1958 participation voluntary • In 1958 exit eliminated • What happened?
Why did productivity collapse? • More than the Great Leap, persisted till 1978 • Simple model with shirking • Agents choose high or low effort • As the collective is large an agent can shirk without having an effect on his share of output this period, so • But if agents shirk then next period agents leave and output goes to , and agents have to supply high effort, as they are on their own. • trigger strategy: if agents defect from the cooperative outcome we revert to the bad outcome in all future periods
Game • We have three possible outcomes • One-time gain from shirking • Future loss
Outcomes • Agent chooses high effort if G < L, or • Shirking more likely if • Output loss is small • Future is discounted heavily • Effort is costly • Graphically • If L > G then trigger strategy supports high effort • This is the situation before 1958 • After 1958 no possibility to play the strategy till 1978
Great Leap Forward • In 1958 Mao launched GLF • “Ten thousand years are too long, seize the day, seize the hour!” • Huge increase in output targets • People's Daily proclaimed that the GLF would propel China to surpass UK in industrial production in 15 years and the US in 20 or 30 years. • Result • National grain output plunged by 15 percent in 1959 and by another 16 percent in the following two years. • Demographers estimate the total number of premature deaths during the GLF famine at between 16.5 and 30 million • How? Why?
"Long live the General direction! Long live the Great Leap Forward! Long live the People's Commune!"
GLF • Official explanation: 3 years of bad calamities • Real explanation • Maoist system made subordinates feel pressure to fulfill and overfulfill targets • CPC created a new rat race for local cadres by exhorting them to “overcome reactionary conservatism” • Initial reports signaled huge increase in output • A initial tally of the 1958 grain output after the fall harvest pegged it at 525 million metric tons (MMTs), up by nearly 170% from 1957 • As a result, government raised agricultural taxes and started backyard furnaces • Since the agricultural problem was now solved it made sense to divert output and labor to industrialization • 16.4 million peasants, about twice the size of the industrial labor force (in 1957) were relocated to cities between in 1958 • more than 100 million peasants were mobilized in the winter of 1957–58 to undertake large irrigation and land reclamation projects, and to operate millions of small “backyard iron furnaces
GLF • Actually, output fell, harvest closer to 200 mmt’s • Grain retained in rural areas fell sharply from 273 kg per capita in 1957 to 193 kg in 1959, and further down to 182 kg in 1960 • This meant nutrition fell => productivity fell as economy was near subsistence => future output fell • To see this suppose that grain output given by • where a is productivity parameter, c is consumption and L is labor allocated to agriculture, • af(c) measures the contribution of nutrition to the labor productivity of an average worker • function f(c) relates production to consumption, capturing the nutrition effect – “S” shape • Consumption next period depends on productivity and procurements, p
GLF • Mao thought a had risen, so he raised p and reduced L • But a had fallen, so ct+1 really falls • But this reduces output next period even more • Malnutrition and famine result • We get a downward spiral till p is reduced and L is restored
Reforms • Early reforms were in agriculture, HRS • HRS meant that peasants could keep fruit of extra effort, so work effort and output increased • Freed labor for other tasks • Relaxation of local self-sufficiency led to crop specialization (return to old crop patterns) and led to large efficiency gains • Diversification into animal husbandry as well • Led to growth of non-farm self employment and family businesses • Early success in agriculture spurred reform to industry • When initial situation is real bad, moderate improvement in incentives can have a very large effect
Dual Track • Combine two tracks in reform strategy • Plan and market • Chinese reform has the character of experiment: the slogan is moshitou guohe • ”crossing the river by stepping from stone to stone” • The essential idea of dual track is to liberalize at the margin. • In agriculture peasants could lease land (15 years) and sell above quota sales • Reminiscent of partial reform in Russia • But different outcome
Dual Track • Dual track requires enforcement • Suppose and that supply and rationing is efficient • Efficient supply means that planned supplies are delivered by producers with the lowest marginal cost, and efficient rationing means that the planned quota is delivered to buyers with the highest willingness to pay. • Further suppose that • Dual Track means that above-quota output is sold in markets
Dual Track Outcomes • Dual track is Pareto improving • Consumers get area A • Consumers also get area C • Under liberalization area C goes to producers • Compensation needed • With dual track rents are preserved but outcomes are efficient at the margin • Requires enforcement to prevent arbitrage
Dual Track: Corruption but growing out of the plan • Firms lobby government for higher input quotas with no increase in plan output • They then sell the inputs at market price • Windfall gains • Problem is lack of enforcement of plan track • This partial and gradual liberalization of pricing opened the door to “growing out of the plan.” • directing incremental output toward market allocation gradually reduced the importance of the plan sector without a political struggle
Dual Track • Quota enforcement key • Market prices exceed plan prices • If no enforcement we go to BB equilibrium • Supply diversion • So state power is key • Notice that system is ripe for corruption • Arbitrage opportunities widespread • Corrupt officials can get rich
Comparison with Big Bang • Simple model with labor supply depending on real wage (availability of consumer goods) • Planners set final goods price to maximize government surplus • Labor used to produce intermediate and final goods • Central planner equates marginal increase in labor supply to marginal cost of producing consumption goods • Planner maintains integrated monopoly to maximize surplus • G maximized at some level of final goods, D* • D > D* marginal increase in labor supply smaller than marginal cost of producing consumer goods
Big Bang Reform • Under Big Bang intermediate producers become monopolists • No restructuring immediately • Under BB, intermediate producers raise price reduce output • This raises cost of final output • Labor supply falls as does government surplus • The reason is that the enterprises do not consider the consequences of their price increases on the profits of the other enterprises. • Since there is less left over for consumers, it is equivalent to a decrease in real wages, and hence labor supply falls.
Dual Track • Under Dual Track intermediate producers still fulfill quotas • No pecuniary externality • Additional sales do not lower the planned price on quota output, the enterprise has an incentive to produce beyond the quota. • This means that the reform raises output in every enterprise. • Above plan output must raise total output • Additional output sold at lower price • Additional intermediate output means more final output • More output means lower final goods price • Implies higher real wage or more D • So government surplus must rise • So output under Dual Track is higher than under central planning