Download
1 / 24
250 likes | 395 Views
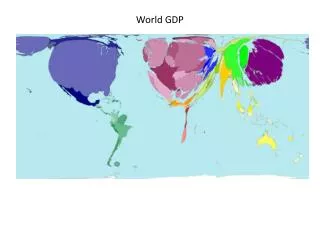
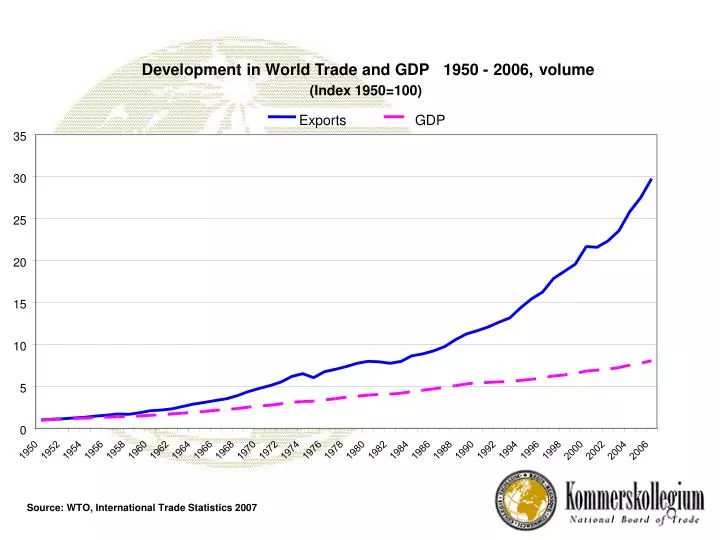
Development in World Trade and GDP. 1950. -. 2006. , . volume. (Index 1950=100). Exports. GDP. 35. 30. 25. 20. 15. 10. 5. 0. 1950. 1952. 1954. 1956. 1958. 1960. 1962. 1964. 1966. 1968. 1970. 1972. 1974. 1976. 1978. 1980. 1982. 1984. 1986. 1988. 1990. 1992.

E N D
Development in World Trade and GDP 1950 - 2006 , volume (Index 1950=100) Exports GDP 35 30 25 20 15 10 5 0 1950 1952 1954 1956 1958 1960 1962 1964 1966 1968 1970 1972 1974 1976 1978 1980 1982 1984 1986 1988 1990 1992 1994 1996 1998 2000 2002 2004 2006 Source: WTO, International Trade Statistics 2007
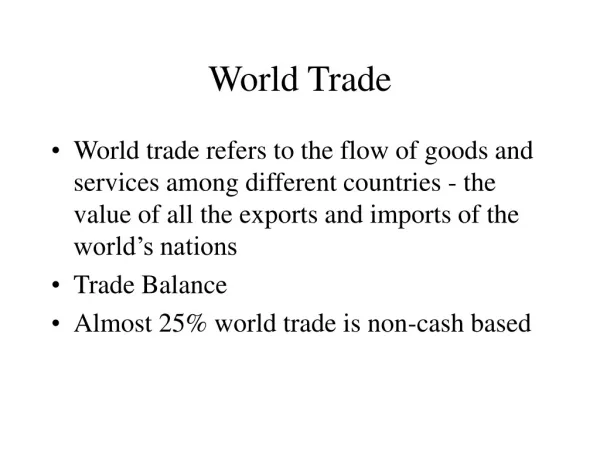
Sweden´s Trade Balance 1980-2007 % of GDP 8,0 7,0 6,0 5,0 4,0 3,0 Per cent 2,0 1,0 0,0 -1,0 -2,0 -3,0 1990 1991 1992 1993 1994 1995 1996 1997 1998 1999 2000 2001 2004 2005 2006 2007 1980 1981 1982 1983 1984 1985 1986 1987 1988 1989 2002 2003 Source: Statistics Sweden.
Sweden´s Current Balance 1980-2007 % of GDP 10,0 8,0 6,0 Per cent 4,0 2,0 0,0 -2,0 -4,0 2004 2005 2006 2007 1980 1981 1982 1983 1984 1985 1986 1987 1988 1989 1990 1991 1992 1993 1994 1995 1996 1997 1998 1999 2000 2001 2002 2003 Source: Statistics Sweden.
Swedish Trade in Goods, Investment Income and Services 1980-2007 % of GDP Trade in Goods Investment income Services 10,0 8,0 6,0 Per cent 4,0 2,0 0,0 -2,0 -4,0 -6,0 1980 1981 1982 1983 1984 1985 1986 1987 1988 1989 1990 1991 1992 1993 1994 1995 1996 1997 1998 1999 2000 2001 2002 2003 2004 2005 2006 2007 Source: Statistics Sweden.
Sweden´s Foreign Trade in Goods(Share in %) Exports Imports* 1987 1997 2007 1987 1997 2007 EU (25) EFTA NAFTA Central- and East Europe Asia - Japan - China Other countries 59,9 13,3 12,6 0,7 7,4 1,5 0,5 6,2 58,8 10,4 9,8 0,2 12,4 3,0 1,5 8,4 60,9 10,7 9,0 0,3 9,7 1,2 1,9 9,4 67,7 8,1 7,6 0,6 10,9 6,0 0,5 5,1 71,7 9,7 6,8 0,0 8,3 2,7 0,8 3,5 71,6 9,5 3,5 0,1 9,3 1,7 3,5 5,9 *) Country of dispatch Source: Statistics Sweden.
Exports to Sweden´s Largest Trade Partners 2007 Value SEK billion Share % Change % Ranking 2007 2006 Exports to 1 1 Germany 119,0 10,4 10 2 3 Norway 106,9 9,4 8 3 2 USA 86,5 7,6 -14 4 5 Denmark 84,9 7,4 8 5 4 United Kingdom 81,5 7,1 4 6 6 Finland 72,7 6,4 7 7 8 Netherlands 57,8 5,1 11 8 7 France 56,7 5,0 6 9 9 Belgium 52,5 4,6 5 10 10 Italy 36,0 3,2 -2 11 11 Spain 32,1 2,8 -4 12 12 Poland 28,0 2,5 24 13 14 Russian Fed. 22,7 2,0 27 14 13 China 22,2 1,9 7 15 15 Japan 13,9 1,2 -17 Source: Statistics Sweden
Imports from Sweden´s Largest Trade Partners 2007 Value SEK billion Share % Change % Ranking 2007 2006 Imports from 1 1 Germany 187,9 18,4 11 2 2 Denmark 93,3 9,1 3 3 3 Norway 87,6 8,6 9 4 4 United Kingdom 70,3 6,9 16 5 5 Netherlands 62,7 6,1 6 6 6 Finland 62,0 6,1 12 7 7 France 50,4 4,9 13 8 8 Belgium 43,1 4,2 9 9 10 Italy 36,3 3,6 14 10 12 China 35,7 3,5 23 11 11 USA 31,9 3,1 1 12 9 Russian Fed. 29,7 2,9 -10 13 13 Poland 29,6 2,9 18 14 14 Japan 17,7 1,7 -2 15 15 Spain 14,9 1,5 2 Source: Statistics Sweden
From Basic Industry Sectors to Manufacturing Industry Share of Sweden´s Exports, current prices 100% 90% Others (Chemicals etc.) Ores 80% Pharmaceuticals Agriculture, food 70% Iron and Steel 60% Wood Pulp and paper Per cent 50% 40% Manufactures 30% 20% 10% 0% 1870 1880 1890 1900 1910 1920 1930 1940 1950 1960 1970 1980 1990 2000 2001 2002 2003 2004 2005 2006 2007 Source: Statistics Sweden.
The Destination of Sweden´s Exports Distributed by countries 100% 80% Rest of the world USA 60% Rest of Europe Germany 40% United Kingdom Nordic Countries 20% 0% 1871-75 1901 1911-13 1921-23 1937 1957 1969 1979 1989 1999 2000 2001 2002 2003 2004 2005 2006 2007 Source: Statistics Sweden.
Sweden´s Exports and Imports 2007 % of total exports Share by commodity groups and imports 50,0 45,0 Exports 40,0 Imports 35,0 30,0 25,0 20,0 15,0 10,0 5,0 0,0 Manufactures Other goods, furniture etc. Wood Iron and steel Chemicals Mineral fuels Food Textiles, footwear Source: Statistics Sweden.
Sweden´s Exports 2007 1 141 SEK billion Mineral fuels Manufactures 5,5% 49,3% Chemicals etc. 11,7% Wood 11,2% Minerals Other goods 10,8% 11,6% Source: Statistics Sweden.
Sweden´s Exports 2006 and 2007 Share by regions 2006 2007 70,0 60,9 59,8 60,0 Share in % 50,0 40,0 30,0 20,0 14,4 13,6 12,4 10,8 9,7 10,1 10,0 2,5 2,1 1,5 1,3 0,0 EU(27) Rest of Europe Africa America Asia Oceania Source: Statistics Sweden.
Sweden´s Exports 2006 and 2007 Value by regions 2006 2007 SEK billion 695,2 651,4 700,0 600,0 500,0 400,0 300,0 164,2 148,6 135,0 200,0 110,0 122,9 110,2 100,0 28,0 14,6 15,8 22,7 0,0 Oceania EU(27) Rest of Europe Africa America Asia Source: Statistics Sweden.
Sweden´s Exports 2006 and 2007 Share by commodity groups 2006 2007 60,0 49,3 49,5 50,0 40,0 Share in % 30,0 20,0 12,1 11,6 10,8 10,8 11,3 10,5 11,7 11,2 5,9 5,5 10,0 0,0 Chemicals Manufactures Other goods Wood Minerals Mineral fuels Source: Statistics Sweden.
Exports to Sweden´s Largest Trade Partners 2007 14,0 12,0 10,4 9,4 10,0 7,4 7,6 7,1 8,0 Share of total Exports in % 6,4 5,1 6,0 5,0 4,6 3,2 4,0 2,8 2,5 2,0 0,0 Italy USA Spain France Poland Finland Norway Belgium Denmark Germany Netherlands United Kingdom Source: Statistics Sweden.
Sweden´s Imports 2007 1 020 SEK billion Mineral fuels Manufactures 44,6% 11,1% Chemicals etc. 12,2% Wood 3,1% Minerals Other goods 10,8% (food, textiles etc.) 18,1% Source: Statistics Sweden.
Sweden´s Imports 2006 and 2007 Share by regions (country of consignment) 2006 2007 80,0 71,6 70,4 70,0 60,0 50,0 Per cent 40,0 30,0 14,2 13,4 20,0 9,3 9,4 4,9 5,1 10,0 0,5 0,4 0,4 0,3 0,0 EU(27) Rest of Europe Africa America Asia Oceania Source: Statistics Sweden.
Sweden´s Imports 2006 and 2007 Share by commodity groups 2006 2007 50,0 44,6 44,4 40,0 Per cent 30,0 18,5 18,2 20,0 12,2 12,5 11,8 11,1 10,8 9,8 10,0 3,1 3,0 0,0 Wood Minerals Mineral fuels Chemicals Manufactures Other goods Source: Statistics Sweden.
Sweden´s Imports 2007 of Mineral Fuels and Products Imports by country of consignment 30 25 20 SEK billion 15 10 5 0 Iran Libya Latvia Others Poland France Finland Estonia Norway Belgium Lithuania Denmark Germany Venezuela Kazakhstan Netherlands Russian Fed United Kingdom Source: Statistics Sweden.
Imports from Sweden´s Largest Trade Partners 2007 18,4 20,0 18,0 16,0 14,0 12,0 Share of total imports in % 9,1 8,6 10,0 6,9 8,0 6,1 6,1 4,9 6,0 4,2 3,5 2,9 3,6 3,1 4,0 2,0 0,0 Italy USA China France Finland Norway Belgium Denmark Germany Netherlands Russian Fed United Kingdom Source: Statistics Sweden.
100,0 80,0 60,0 40,0 20,0 0,0 -20,0 -40,0 Sweden´s Trade in Services 1993 - 2007, net Transports Travel Other services SEK billion 1993 1994 1995 1996 1997 1998 1999 2000 2001 2002 2003 2004 2005 2006 2007 Source: Statistics Sweden.
Other Services 2006 and 2007, net 2006 2007 SEK billion 40,0 35,0 30,0 25,0 20,0 15,0 10,0 5,0 0,0 -5,0 Insurance Government Construction information Computer and Communications Personal cultural, Other business and recreational Financial services Royalties and license fees Source: Statistics Sweden.
Sweden´s Net Exports 2006 and 2007 Value by commodity groups SEK billion 2006 2007 121,3 140,0 107,9 120,0 95,6 94,6 100,0 80,0 60,0 22,9 22,3 20,5 40,0 8,4 20,0 0,0 -20,0 -40,0 -51,2 -53,1 -60,0 -56,8 -62,7 -80,0 Wood Minerals Chemicals Mineral fuels Machinery, Other goods transport equipment Source: Statistics Sweden.
Sweden´s Trade in Pharmaceuticals 1995 - 2007 SITC 54 medical and pharmaceutical products Exports Imports Net SEK billion 70,0 60,0 50,0 40,0 30,0 20,0 10,0 0,0 1995 1996 1997 1998 1999 2000 2001 2002 2003 2004 2005 2006 2007 Source: Statistics Sweden.