Download
1 / 14
140 likes | 144 Views
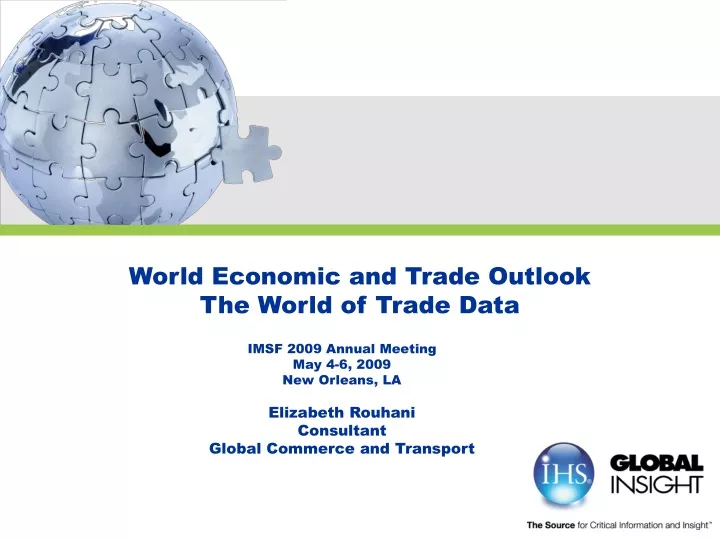
This report analyzes the world economic and trade outlook, highlighting the performance of developed and developing countries, seaborne tonnage, container trade volume, and overall trade value. It offers historical data, 20-year forecasts, and insights from various sources. Expert consultant Elizabeth Rouhani provides valuable information on trade concepts, country-specific data, and the challenges in reconciling trade statistics. Contact Elizabeth Rouhani at elizabeth.rouhani@ihsglobalinsight.com for more information.

E N D
World Economic and Trade OutlookThe World of Trade Data IMSF 2009 Annual Meeting May 4-6, 2009 New Orleans, LA Elizabeth Rouhani Consultant Global Commerce and Transport
IHS Global Insight Global Insight was founded in 2001 with the merger of WEFA (est. 1963) and DRI (est. 1968). In the 7 years that followed, we expanded our offerings and expertise through key acquisitions. In October 2008, Global Insight became part of the IHS family.
The Business Cycle is Not DeadThe World Economy Recovers Starting in 2010 (Percent change for the world economy)
Economic Performance Varies by RegionDeveloped Country Economies Are Shrinking (Real GDP, percent change)
World Seaborne Tonnage Falls 2.8% in 2009 (Percent Change in Tonnage of World Sea Trade)
World Container Trade Volume Down 5.8%in 2009 (Percent Change in Volume of Container Trade, in TEUs)
TOTAL TRADE VALUE (Nom-Real) TOTAL TRADE METRIC TONS SEA OTHER AIR LIQUID BULK CONTAINER TONS DRY BULK GENERAL CARGO 40’ 20’ TEUs World Trade Service • 16 Trade Concepts • 70 Country/regions (World) • 77 ISIC Commodity categories • History • Value 1980 • Tons 1995 • 20 years forecast horizon • Updated quarterly
Sources for Trade and other Indicators UN Statistics Canada* US Census Bureau Government Agencies IHS Global Insight World Trade Service OECD Ports Eurostat Others Industry Public Sources
UN Data Experience • 85% of trade is reported in weight. • Late reporting: 2 year lag for some countries • Data revisions for timeseries • Mirror trade discrepancies • Countries do not report all their trade • Saudi Arabia exports to Taiwan • Taiwan not official member state of UN, therefore cannot show their trade. • Areas, nes • 9310 SITC Special Transaction commodity • Unit Values inconsistencies
UN – EUROSTAT data differences • Reconciliation of trade statistics…is it possible? • Main difference is the methodology for reporting. • Belgium maintains 2 different trade datasets National Concept Country of Origin for Imports United Nations Belgium EU Concept Country of Consignments Eurostat
US Census Bureau • All methods data – vessel, air, and container • Custom Districts • Port level • HS 10 digit or 6 digit • Only a few commodities have been difficult to size • Fertilizers • Coal
WTS vs Other Sources • Ports • PIERS • Other Sources • Our numbers are based on final destination • No transshipments • No military cargo • For containers, it is based on full not empty. • Do not account for container movements
Thank You! Elizabeth Rouhani elizabeth.rouhani@ihsglobalinsight.com