Download
1 / 18
180 likes | 309 Views
Spectroscopy. Energy of a molecule can be written (to a reasonable approximation) E = E kinetic +E rotational +E virbational +E electronic +E nuclear

E N D
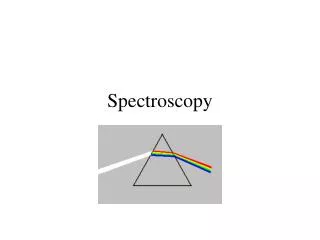
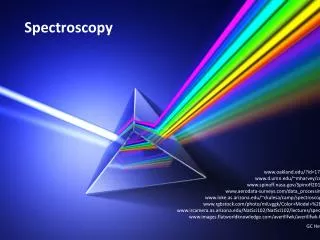
Spectroscopy • Energy of a molecule can be written (to a reasonable approximation) • E = Ekinetic+Erotational+Evirbational+Eelectronic+Enuclear • Molecules, M, tend to sit in their lowest el and vib state. When electromagnetic radiation is incident on M, if emr is resonant with an energy gap to another state of M, then M can be ‘pushed’ into new level: spectroscopy is the measure of that energy and how easily it happens. • Microwave: rotations; • Infrared: vibrations; • UV-visible: electronic (+vibns).
Absorbance Bonds Molecules Spectroscopy Molecules are 'glued together' by electrons between the atoms. ~ Two electrons per bond. Approximation: electrons can be put into independent orbitals (with defined spatial characteristics). Two of Opposite spin. Two types of bonds are important for bio molecules: s (sigma) bonds look like s-orbitals when viewed along the bond axis. (pi) bonds look like p-orbitals (dumbbells) when viewed down the bond axis Also non-bonding pairs, e.g. lone pairs on N & O Ultra violet/visible (UV/vis): how much energy is required to push electrons to new orbitals. Infra red (IR): strong bonds high cm1, bends low cm1
p-electron systems p-electrons are held less tightly than electrons so require less energy to excite to unoccupied orbitals Many biological systems have alternating = and - bonds making conjugated systems: electrons held even less tightly coloured compounds. E.g. b-carotene Most biomolecule spectroscopy used is pp* or np*
Electrons bonds structure UV/visible light:l ~ 180 nm – 800 nm, energy hn = hc/l causes electrons to go to higher energy levels. l required depends on electron rearrangement needed. In solution: broad bands due to diff. vibrational levels in excited state & molecules having slightly different energy levels. UV: –350 nm Vis: 400 nm – Excited electronic state • . Ground electronic state Ground vibn’l level r
Absorption spectra of DNA & proteins With proteins and DNA the transitions we usually study are n * and * so can access them with normal spectrometers. Below 200 nm need nitrogen purging because O2 absorbs
Polarization of transitions Directionelectrons move during a transition Often defined by the symmetry of the molecule * transitions are in the plane of the chromophore Absorbance: A = log(Io/I) = log(intensities in/out) Beer Lambert A = ecl, e extinction coefficient (units?), c concentration, l length (cm) Oriented samples and polarised light:only light whose electric field pushes the electrons along the polarisation direction causes a transition
Proteins Far UV (250 – 180 nm) dominated by peptide group Many buffers absorb here — so beware! First n* 210 – 220 nm, weak (e~100 cm1dm3mol1) First * 180 nm, stronger (e ~ 7000 cm1dm3mol1) In -helix only has a component at 208 nm ?? ns* transition 175 nm, charge transfer between amides Side chains absorb in this region: aromatics, Asp, Glu, Asn, Gln, Arg & His. Usually small. n* *
Proteins Near UV — 'aromatic' side chains. Tryptophan: Indole side chain, absorbs 240 – 290 nm, 3 or more transitions, e~5,000 cm1dm3mol1 Tyrosine: 274 nm, e~1400 cm1dm3mol1 Phenyl alanine: 250 nm, e~200 cm1dm3mol1 Cystine (disulfides): 250–270 nm, e~300 cm1dm3mol1 pH: tyrosine & tryptophan have protonation sites that directly affect conjugation of chromophore tyrosine -OH, pKa ~ 10.9 shifts from 275 nm to 295 nm hemes, flavins, pyridoxal phosphate, metalloprotiens have intense UV or visible absorption bands.
Protein concentration from UV absorbance e(280 nm, tryptophan) = 5,700 mol1 dm3 cm1 e(280 nm, tyrosine) = 1,300 mol1 dm3cm1 So can determine protein concentration using: e280 = (nW (5690) + nY(1280) + nC(120)) Equation is valid provided:- · no contribution from light scattering · no other chromophore (e.g. cofactor) in the protein · no other absorbing contaminant, e.g. nucleic acids Alt. 1 mg/mL av. abs = 1.1±0.5 Or 1.55 A280 - 0.76 A260 = mg protein/mL (accounts for nucleic acid contamination) up to 100% error Or use chemistry to create visible molecules from reaction with peptide backbone - need standards with similar response
Nucleic acids Near UV absorbance of nucleic acids due (almost) exclusively to planar purine and pyrimidine bases Backbone from 190 nm Each 'simple' band observed is a number of transitions Ligands bind change DNA A and ligand A. Intercalators upon DNA binding: red l shift (4-20nm) & hypochromoism (- up to 50% A) and less structured spectrum
DNA melting curves DNA absorbance as a function of Temperature: helix coil transition. DSSS + ~ 10% Abs. Tm is 50:50 DS:SS. Maximum of derivative is ~ Tm Determine thermodynamic data from shape of curve. AT rich Tm lower than GC rich A increases due to loss of - stacking interaction (cf. intercalators) A 80/C 40 dA/dt
Protein infra red absorbance Use cm1 as energy unit Amide I C=O stretch: solution ~ 1690, solid ~ 1650 cm1 Amide II N-H bend: solution ~ 1600, solid ~ 1640 cm1 -helix + unordered: 1650 cm1 -sheet:1618, 1632, 1661 cm1 -turns: 16601679 cm1 non H-bonded C=O: 1700 cm1 Use D2O in most cases. CaF2 cells BSA 20 mg/mL 0.1 mm pathlength D2O
Extinction coefficients varies with species, , and concentration. To determine (ideally) 3 independent weighings + 2 serial dilutions Beer Lambert Law. Often use single point, but beware! Watch effects of pH — changes species & hence .
Binding constants from UV usually changes when two molecules bind. Simple e.g. change pH to add or take proton. 1: extinction coefficient of species 1 x1:mole fraction of species 1 A: total absorbance ctot: total analyte concentration etc Isosbestic points (constant absorbance during a titration where the total concentration of analyte stays the same, but species is in more than one form) means that it is in two states.
Determine the concentration of p-nitrophenol (PH) and its conjugate base (P-) at pH = 7.2 from the data at 315 nm. A315(pH=4.5)=0.55; A315(pH=10.3)=0.08; A315(pH=7.2)=0.30 A(pH=7.2) = {[PH]7.2(PH@315) + [P-]7.2(P@315)}l (PH@315)= 0.55/(5105) = 11,000 moles1 dm+3 cm1 (P@315)= 0.08/(5105) = 1,600 moles1 dm+3 cm1 [PH]7.2=(5105)x1; [P]7.2=(5105)x2=(5105)(1x1) A(pH=7.2) = 0.30 = 5105 [11,000x1+1,600(1-x1)] X1={0.30/(5105)1,600}/{11,0001,600} = 0.47 X2=10.47=0.53 [PH]7.2=(2.3105); [P]7.2=(2.7105) NB if pH = 7.2, then [H+] = 107.2 So equilibrium association constant for H+ and Pis: Kassoc=[PH]/{[P][H+]}=(2.3105)/{(2.7105) 107.2}=1.4107
Roles in spectroscopy of: • Electromagnetic spectrum, esp. frequencies and wavelengths of UV, visible and IR • Lenses • Mirrors • Gratings and monochromaters • Prisms and quarter/half wave plates and monochromaters • Photoelastic modulators • Diode detectors • Photomultiplier tubes • Why does Beer-Lambert law work (relate to definition of absorbance) • IR light source • Data processing of photon count to plot on screen. • Compensation of lamp energy variations