Download
1 / 27
270 likes | 353 Views
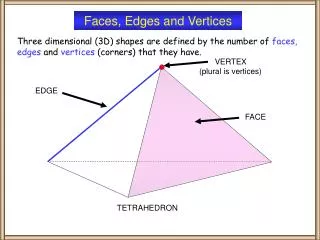
Photoionization Modeling: the K Lines and Edges of Iron. P. Palmeri (UMH-Belgium) T. Kallman (GSFC/NASA-USA) C. Mendoza & M. Bautista (IVIC-Venezuela) J. Krolik (JHU-USA). Plan. Introduction Atomic Data Photoionized Plasma Modeling Conclusions. Serlemitsos, et al, 1973. Introduction.

E N D
Photoionization Modeling: the K Lines and Edges of Iron P. Palmeri (UMH-Belgium) T. Kallman (GSFC/NASA-USA) C. Mendoza & M. Bautista (IVIC-Venezuela) J. Krolik (JHU-USA)
Plan • Introduction • Atomic Data • Photoionized Plasma Modeling • Conclusions
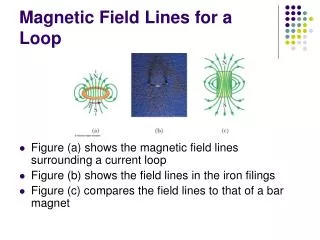
Serlemitsos, et al, 1973 Introduction • Iron K lines are observed in (almost) all X-ray sources • First reported in rocket observations of the supernova remnant Cas A
Tanaka et al., 1996 Introduction • Appear in a relatively unconfused region • Emitted efficiently over wide range of temperatures and ionization states • Relativistically broaden and red-shifted lines observed in galactic black hole candidates
Introduction The world of X-ray observatory is changing: RXTE EXOSAT Compton ASCA XMM 1000 km/s Chandra 300 km/s Astro-E2
Atomic Data • Motivation: they were scarce and not sufficiently accurate especially for the M-shell ions (Fe I-XVII) • Methods: standard atomic codes, i.e. AUTOSTRUCTURE (Badnell), HFR (Cowan) & BPRM (IP/RmaX Projects)
Atomic Data • L-shell ions (Fe XVIII-XXV) CI: {2s,2p}N+[1s]{2s,2p} N+1+up to double excitations to M-shell Semi-empirical corrections: compilation of Shirai et al (2000) • M-shell ions (Fe I-XVII) Focus on K-vacancy states produced by removing a 1s electron from the ground configuration No experimental energies Ab initio calculations Few experimental data (wavelengths): Fe X & solid state
Core Relaxation Effects Electrons in K-vacancy & valence configurations see radically different potentials different orbitals for initial & final states of inner-shell transitions affects level energies, wavelengths & rates !!! -increase radiative rates by ~5-10% -increase KLL rates by ~10% -no systematic effect on KLM rates -decrease KMM rates by ~10%
Damping Effect Resonances before K-edge Participator channels Spectator channels (Damping channels)
Damping Effect: Photoabsorption With damping Without damping Fe XVII Fe XXIII
Damping Effect: Electron Impact Without damping Fe XIX With damping 2p43P2 [1s]2p5 3Po2 [1s]2p5 3Po1 [1s]2p5 3Po0
Line Energy vs. Ionization Stage Blue=Makishima Black=these studies Complicated K line structure Line moves to red near Fe IX
Edge Energy vs. Ionization Stage Blue=Makishima Black=these studies In first row ions, ground level is split by various valence configurations In 2nd and 3rd row ions, Splitting is smaller, Results differ significantly From previous
MCDF Jacobs- Rosznyai experiment HFR Auto-S Kaastra-Mewe K/K ratio vs. Ionization Stage K/Kratio is a potential diagnostic of ionization
Experiment Auto-S HFR Kaastra-Mewe Jacobs-Rosznyai Fluorescence Yield vs. Ion. Stage
Photoionized Plasma Modeling With XSTAR • Photoionization of a gas by intense external X-ray source (dominant) • Other processes affecting ionization, excitation & temperature are in equilibrium • Local conditions (ionization fractions, temperature, opacity) parameterized by • =Ionization parameter • =4Ionizing flux/gas density
Photoionized Plasma Modeling: Atomic Processes • Each ion has ~3-30 K-vacancy levels which can be populated by photoionization • ~4-100 K lines per ion considered in our treatment
temperature Ionization balance =Ionization parameter=4Ionizing flux/gas density Ionization Balance & Temperature 104<T<108K
Emissivity j~ n2 Line Emissivity vs.
Log =2 Line Emissivity vs. density
Line Emissivity vs. density (continued) Log(n)=12 Log(n)=16
Line Emissivity vs. Optical Depth Multiplier Lines can be suppressed by Auger destruction
Emissivity averaged over constant density slab with log(x)=2 Line Emissivity vs. Column Density Shift of ionization from high to low will be detectable in reprocessed spectrum 1/N decrease marks the Breakdown of the optically thin approximation
XMM Epic PN Astro-E XRS Assuming log()=2, log(N)=23, 100 mcrab source, tobs= 100 ksec Simulated Spectra
Conclusions • Structure of Iron K shell is more complicated than has been previously appreciated, & care is needed to accurately compute useful quantities • There is a shortage of experimental data needed for accurate spectral modeling especially in intermediate & low ionization stages • Converging series of damped resonances act to smear absorption edges • Emission lines contain structure which has diagnostic value, even for low ionization gas