Download
1 / 70
700 likes | 706 Views
Inland Empire Forecast. John Husing, Ph.D. Economics & Politics, Inc. Chief Economist, IEEP. U.S. Jobs Still Setting Records. 17.9%. Add Potential Workers: Given Up Or Part Time. 10.1%. 7.5%. 3.9%. Inland Empire: 3.9%. Inflation Worry. 3.6%. 1.9%.

E N D
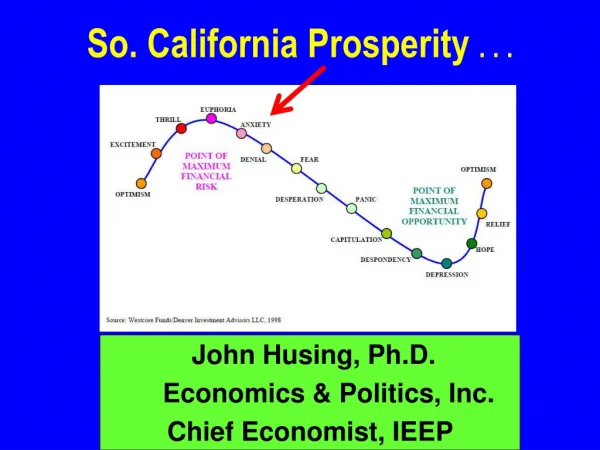
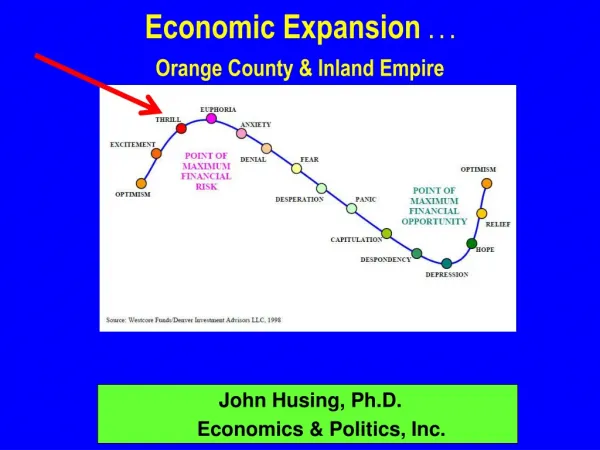
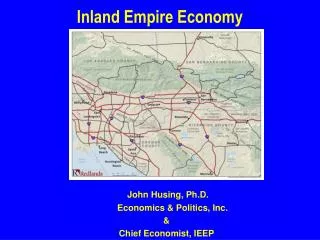
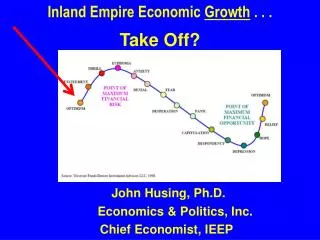
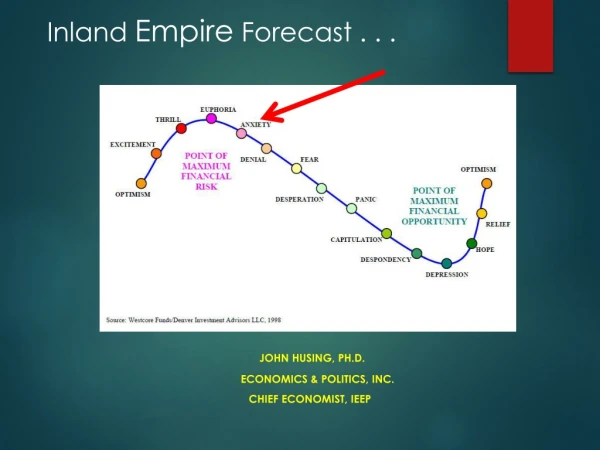
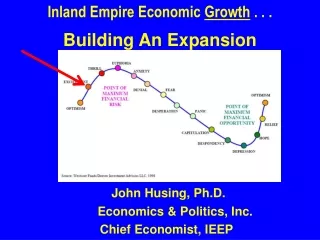
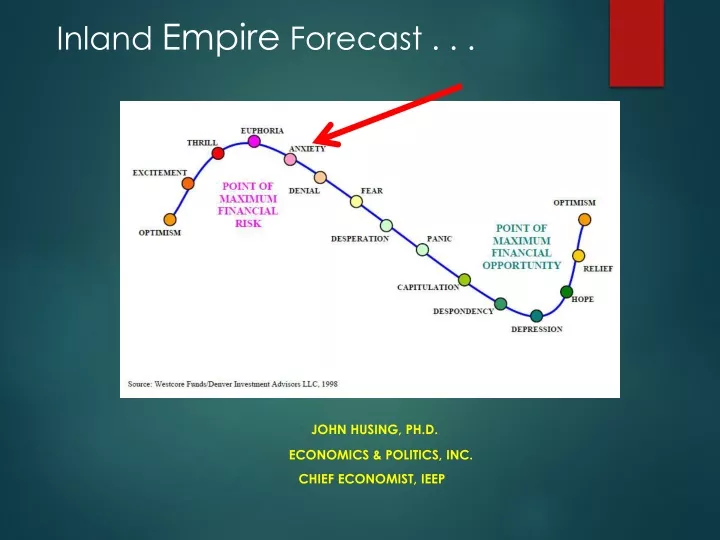
Inland Empire Forecast . . . John Husing, Ph.D. Economics & Politics, Inc. Chief Economist, IEEP
17.9% Add Potential Workers: Given Up Or Part Time 10.1% 7.5% 3.9% Inland Empire: 3.9%
Inflation Worry 3.6% 1.9%
Yield Curve Recession: 2020 Likelihood Rising 2 Year to 10 Year 0.18%
Inland Empire’s Powerful Job Growth! Percent 2018e above 2007 I.E. CA US 15.8% v. 11.0% v. 8.6% 2018 Confession Forecast: 45,000 jobs 3.1% 4.7% Unemployment Actual YTD: 46,110 Jobs 3.1% 4.2% Unemployment
Job Growth by Region 2nd Largest 2018 Absolute Job Gain in So. CA!
Inland Empire Population Greater Than 25 of 50 States
Population Forecast, 2018-2045 2045: 6,119,497 1,111,783
Median Household Income, 2017Deducting Housing Costs Above IE
Poverty: Falling With Job Creation 23.5% 16.4%
Educational Levels: Slow Gains 46.3% 29.2%
$ Payroll Spent $ Payroll Spent $ Payroll Paid
Health Care Job Growth 2011-2018 9.6% of Job Growth
Median Health Care Pay: 2018 $62,363
ACA Impact Health Care Demand & Quality of Life -60% Drop in Uninsured
2018 Forecast: 2018e 1,800 2019 Prospect: 2,000
Logistics Job Growth 2011-2018 23.6% of Job Growth
Median Logistics Pay: 2018 $47,946
Skill Ladders Based on Education for PositionMedian Pay Warehousing, Inland Empire 2018
E-Commerce Growth 14.5%
Net Industrial Absorption 20.2 million
Industrial Rates & Vacancies Lease Rates Per Square Foot Per Month, Sep-2018 Inland Empire $0.56 3.6% Ventura $0.72 3.0% Los Angeles $0.84 1.1% Orange $0.92 1.5% San Diego $0.94 4.1% Source: CB Richard Ellis
Industrial Lease Rates Up 29.0%
ONT Airport Cargo Record Volume 16.1%
2018 Forecast: Space v. Regulators 2018e 11,400 2019 Prospect: 10,000
Manufacturing Job Growth 2011-2018 4.0% of Job Growth
2018 Median Manufacturing Pay $54,800
CA Electrical Cost +74.6% +83.5% +135.4%
Construction Job Growth 2011-2018 12.4% Of Job Growth
Median Construction Pay: 2018 Best Paying Blue Collar Sector $53,322
Home Prices +4.5% -9.6%