Download
1 / 55
550 likes | 717 Views
Economic Expansion . . . Orange County & Inland Empire. John Husing, Ph.D. Economics & Politics, Inc. After Losing 8.71 Million Jobs … Now At A Record Level of Jobs U.S. Jobs Long Slow Growth - Not Over-Heating. 18.0%. 10.6%. 8.6%. 4.3%.

E N D
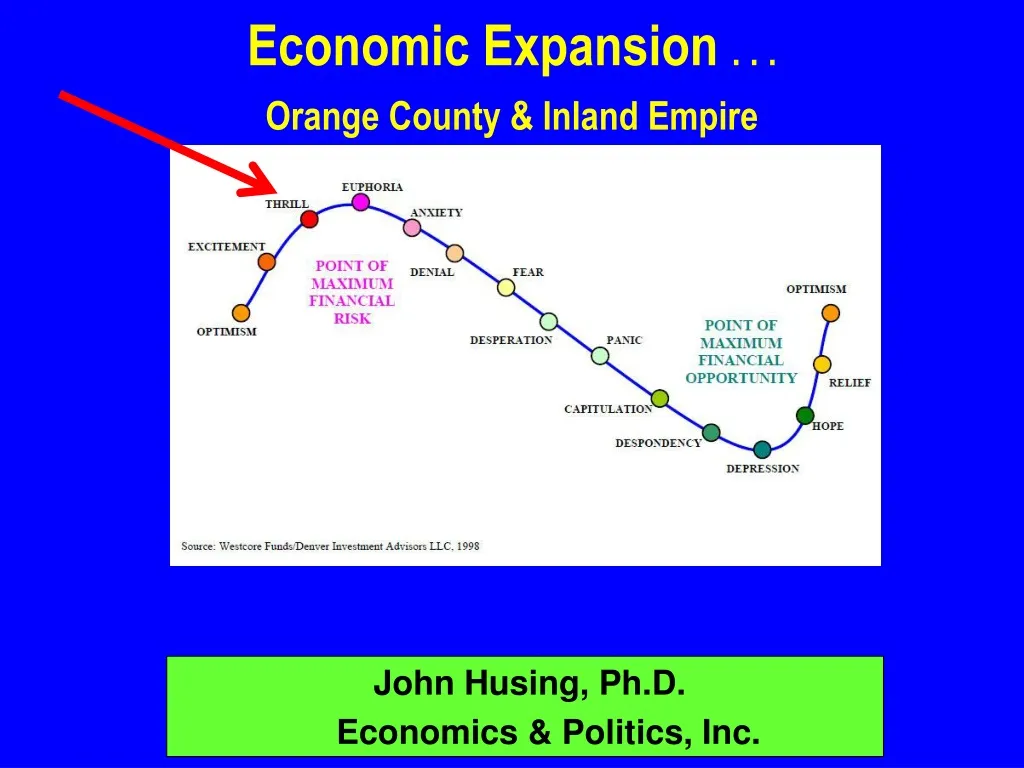
Economic Expansion . . . Orange County & Inland Empire John Husing, Ph.D. Economics & Politics, Inc.
After Losing 8.71 Million Jobs … Now At A Record Level of JobsU.S. Jobs Long Slow Growth - Not Over-Heating
18.0% 10.6% 8.6% 4.3%
California Job Gains/Losses Up 1,368,852 8.6% Up 2007 15,848,033 2017e 17,216,885 Recovery 2,576,300 Great Recession -1,178,600
Growth was the 2nd & 4TH LargestAbsolute Job Gain in California in 2016!
Gold Mine Theory Secondary Tier Primary Tier
OC - High Paying Professionals, Mgmt., Scientific, Utilities, Mining … Very Strong! 2011-2017 16.8% of Growth Median Pay $76,905
Professionals & Mgmt., Higher Ed., Mining Utilities, Information Group Slowly Adding Jobs 2011-2017 1.7% of Growth Median Pay $73,279
Office Vacancy Rates Still Some Weakness! 2017 Sq. Ft. 2017Q2 SF/Mo. Orange Co. 101.6 mil. 9.6% $2.75 San Diego 77.7 mil. 10.2% $2.84 Inland Empire 24.7 mil. 11.8% $1.90 L.A. Co. 204.5 mil. 13.3% $3.09
OC - Health Care Moderately Strong! • 2011-2017 • 8.4% of Job Growth • Median Pay $61,715
Orange County Overserved by Health Care Workers -12.9% Fewer People Per Health Care Worker in 2015
Health Care Jobs: Continuous Growth • 2011-2017 • 10.8% of Job Growth • Median Pay $60,768 Inland Empire’s Best Sector for Higher End Jobs
E-Commerce Growth RatesYear Over Year by Quarter • 1.1% • 16.2% • 8.9%
Industrial OverwhelminglyIn The Inland Empire • Four Qtrs. IE Net Absorption: 15.9 million Sq. Ft. • Four Qtrs. OC Net Absorption: 1.0 million Sq. Ft.
Industrial Vacancy Rate Disappearing Everywhere! 017 Sq. Ft. 2009Q3 2017Q2 San Diego 142 mil. 12.0% 3.7% Orange Co. 255 mil. 6.5% 1.4% Inland Empire 506 mil. 12.8% 3.3% L.A. Co. 940 mil. 3.2% 1.1%
OC - Logistics Slow Growth! • 2011-2017 • 3.2% of New Jobs • Median Pay $49,443
Logistics Powerful Job Growth • 2011-2017 • 20.6% of New Jobs • Median Pay $46,708
PM 2.5: Diesel Pollution • 245 Million Sq. Ft. of Net New Facilities • -95.8% • -44.7%
OC - Manufacturing … Weak Growth! • 2011-2017 • 1.8% of Job Growth • Median Pay $55,900
Inland Empire Manufacturing Jobs • 2011-2017 • 5.2% of Job Growth • Median Pay $51,385
OC - Domestic Out-Migration: Returns -285,949 17 Years or -16,821 per year
IE - Domestic In-Migration Stalled -4,155 9 Years -462 per year
OC - Construction … Very Strong! • 2011-2017 • 14.3% of Job Growth • Median Pay $56,993
Inland Empire Construction Jobs • 2011-2017 • 15.7% of Job Growth • 30.3 % Share in 2017 • Median Pay $52,604
Low Paying Sectors … Large Share of Growth! 2011-2017 45.2% of Job Growth Median Pay $31,238
Low Paying Job GrowthRetail, Consumer & Bus. Services, Hotel, Eat & DrinkAmusement, Agriculture, Employment Agency 2011-2016 40.0% of Job Growth Median Pay $32,750
Retail Markets 2017 Sq. Ft. 2017Q2 SF/Mo. San Diego 69.5 mil. 5.0% $2.28 Orange Co. 85.3 mil. 3.9% $2.32 L.A. Co. 109.6 mil. 5.2% $2.52 Inland Empire 111.5 mil. 7.8% $2.03