Download
1 / 26
350 likes | 894 Views
3. Rainfall-runoff relationships Methods of assessment. Factors that influence surface runoff Physical-geographic factors ( natural , non-manageable ). Climatic (meteorological): Precipitation Type of precipitation (rain, snow [initially less runoff, but ! melting season] , sleet, etc.)

E N D
Factors that influence surface runoff Physical-geographic factors (natural, non-manageable) Climatic (meteorological): • Precipitation • Type of precipitation (rain, snow [initially less runoff, but ! melting season], sleet, etc.) • The rate (amount) and intensity • Duration of rainfall • Direction of storm movement • Distribution of rainfall over the drainage basin • Previous weather (e.g. precipitation that occurred earlier and resulting soil moisture) • Time of year/season • Summer - evapotranspiration rates higher, photosynthesis in plants - at a maximum • Other conditions that affect evapotranspiration - temperature, wind, relative humidity…
Dangerous rainfalls • Summer storms (short time, high intensity) • are significant for smaller watersheds (outflow volume, peak) • flash floods • enhance erosion and transport processes in the watershed (bad quality of water in streams, smaller potential flow in channels and smaller volumes of reservoirs) • Regional rainfalls (long duration of rainfall) • high amount of water (area + time period) • regional floods • Spring rainfalls (snow cover present) • + sharp rise in temperature ð quick thaw ð sharp increase in overland flow • + frozen ground underneath the snow ð rapid flow on ice ð increasing discharge
Physical-geographic factors(natural, non-manageable) Characteristics of watershed • Watershed area – volume and culmination of total runoff • Shape of watershed – time of concentration to the outlet • Elevation • Slope of the area • The steeper the slopes, the lower the rate of infiltration and faster the rate of run-off when the soil is saturated (saturated overland flow) • Strong influence on erosion and transport processes • Length of slope and length of valley – lag time to the valley and to the outlet
Physical-geographic factors(natural, non-manageable) Geological and soil characteristics • Bedrock permeability - Run-off will occur quickly where impermeable rocks are exposed at the surface or quickly when they underlay soils (limited amount of infiltration). • Soil permeability - Soils with large amounts of clay do absorb moisture but only very slowly - therefore their permeability is low. • Thickness - The deeper the soil the more water can be absorbed. • Infiltration capacity - Soils which have larger particle sizes (e.g those derived from the weathering of sandstones) have larger infiltration capacities. • The infiltration capacity is among others dependent on the porosity of a soil which determines the water storage capacity and affects the resistance of water to flow into deeper layers. • Initial conditions (e.g. the degree of saturation of the soil and aquifers)
Anthropogenicfactors (manageable) Land use (e.g. agriculture, urban development, forestry operations) • Direct influence on retention capacity, hydrologic balance of watershed a the volume of direct runoff) • Measures: • Increasing afforestation • Increasing meadow area at the expense of arable land • Limit of impervious surface • Prefer pervious road construction (forest and field) Vegetation type and cover • Interception reducing initial surface flow • Evapotranspiration • Infiltration (the root systems) • Velocity of overland flow • Preferable vegetation cover to increasing retention capacity: forests a meadows a close-seeded a grains a row crops Agriculture • Irrigation anddrainageditches increasing the speed of water transfer • contour tillage • Tillage on wet land compresses the subsoil - creating a "plough pan" a decreasing water holding, infiltration and increasing run-off/erosion.
Human activities - development and urbanization: • imperviousness - natural landscape is replaced by impervious surfaces (roads, buildings, parking lots) - reduce infiltration and accelerate runoff to ditches and streams • removal of vegetation and soil • constructing drainage networks and underground sewer increase runoff volumes and shorten runoff time into streams -> the peak discharge, volume, and frequency of floods increase in nearby streams
River network • Routing and detention • Drainage density • This ratio is the length of river course per area of land. The larger the amount of streams and rivers per area the shorter distance water has to flow and the faster the rate of response. • River conditions Surface depressions, marchlands, wetlands • Storage , hydrologic balance Reservoirs, ponds etc. • Important storage volumes a retention capacity • Ecological balance - ecosystems • Prevent or delay runoff from continuing downstream • Decrease the peak discharge • Protection of the low-lying land downstream. • Water extracted for industry, irrigation, and domestic use, also reduce discharge. • ! reservoir aggradation (storage volume) - erosion control measures • Dry reservoirs – polders a temporary storageduring higher discharge (floods) a usually used as meadows
Precipitation – spatial variability • is measured in gauges or by radar Representation of precipitation depth spatial variability in a catchment: • Arithmetic mean • Polygons(Thiessen) • Isohyets Isohyet or isohyetal line • line joining points of equal precipitation on a map. Isohyetal map
Precipitation – temporal variability • A hyetograph • a graphical representation of the amount of precipitation that falls through time • is used in hydrology to illustrate the temporal variability of precipitation • Characteristics • Intensity (depth / time interval) • maximum • average • Cumulative intensity • Maximum depth • Time period
I [mm/min] Return period [years] D [min] Extreme of rain events Statistic analysis of maximum rainfall events IDF curves: • relations between intensities, duration and frequency of rain events • Intensity – I (mm/min) • Duration – D (min) • Frequency – F (1/years) • probability of different rain event intensities for different durations (5, 10, 15, 30 … minutes, … 24 hours) • an each curve represents a certain frequency of occurrence or a certain return period expressed in terms of years. N value: • the average over a number of years of observation • Value that is exceeded ones per N years (return period) • Rainfall depth (mm) of certain duration (e.g. 24 hours) whose probability of appearance is 1/N = Frequency (1/years)
Hydrograph • hydro- water, -graph chart • plots the discharge of a river over time • a representation of how a watershed responds to rainfall. Characteristics: • Peak discharge Qmax(m3.s-1) • The highest point when there is the greatest amount of water in the river. • Time of peak(min) • VolumeV (m3) • Rising limb • The part up to the point of peak discharge. • Falling limb • The part after the peak discharge.
Flood frequency curve probability distributions Extreme discharge • Extreme values - the average over a number of years of observation • Maximum (N value) QN(m3/s): • Value that is exceeded ones per N years (return period) - statistically • Discharge (m3/s) whose probability of appearance is 1/N = Frequency (1/years) • Are required for the design of dam, spillways, nuclear power stations, major bridges… • important for assessing risk for highly unusual events, such as 100-year floods. • Minimal Qm(l/s): • Value (discharge) that is exceeded m-days per a year – statistically • Important for dry seasons, ground water storage
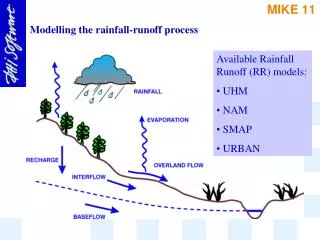
Interception + retention Direct runoff The surface runoff process Rainfall excess = rainfall - losses = = rainfall - interception - surface retention - infiltration Direct runoff = surface runoff + interflow
Curve Number Method (SCS-CN) • A method for simulating rainfall-runoff processes • Developed by SCS (Soil Conservation Service – 1972) • Widely used and efficient method • Determines the approximate amount of direct runoff from a rainfall event in a particular area. • Used for small catchments CN • An empirical parameter for predicting direct runoff. • Developed from empirical analysis of runoff from small catchments and hillslope plots monitored by the SCS.
Curve number (CN) depends on… • Soil • 4 classes (A – D) according to infiltration rate • Cover and hydrologic condition of the land surface • Various types of vegetation and crops, land treatments and crop practices, paving and urbanization • Antecedent wetness • 3 classes of antecedent moisture condition (AMC) – dry, average, wet The bigger CN the higher runoff volume
CN catalog The bigger CN the higher runoff volume
Volume of runoff Oph – volume of direct runoff in m3, Ho – depth of runoff in mm, F – watershed area in km2, Hs – depth of rainfall in mm, A – potential retention in mm 0.2*A – initial abstraction in mm Hs - 0.2*A – effective storm rainfall in mm CN – curve number for
CN method Rainfall depth • Hydrologic soil • groups • Land use • AMC Volume of direct runoff Temporal distribution of runoff (hydrograph)
Unit Hydrograph - UH UH is a hypothetical response of a catchment to unit rainfall excess - empirical Original concept - Leroy Sherman (1932) It’s been developed since and applied in many versions. The use: hydrologic models – known rainfall depth → runoff volume → temporal distribution
Unit hydrograph method • Response function • input - rainfall excess (unit volume, constant intensity, uniform distribution over a catchment) • output – direct runoff • assumptions – principle superposition or linearity and temporal invariance • Superposition • Output rate is dependent linearly on input rate • Temporal distribution is not influenced by input rate • Result output equals sum of outputs resulting from unit inputs • Temporal invariance • Starting time of input has no influence on rate or temporal distribution of output
Unit hydrograph – 1 pulse Q(t)=Pef.u(t)= u(t) ..pro Pef =1 Q(t)=Pef.u(t)= I. Dt.u(t) ..pro Pef ≠1 Q(t) t [h]
Composite UH Q(t) t [h]