Download
1 / 8
80 likes | 150 Views
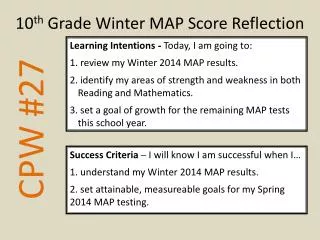
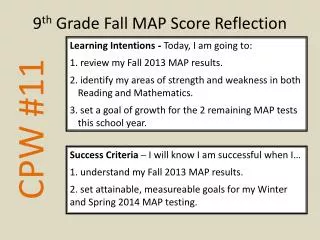
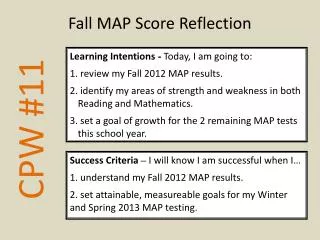
Learning Intentions - Today, I am going to : review my Fall 2013 MAP results. identify my areas of strength and weakness in both Reading and Mathematics. set a goal of growth for the 2 remaining MAP tests this school year. CPW #11. 12 th Grade Fall MAP Score Reflection.

E N D
Learning Intentions - Today, I am going to: • review my Fall 2013 MAP results. • identify my areas of strength and weakness in both Reading and Mathematics. • set a goal of growth for the 2 remaining MAP tests this school year. CPW #11 12thGrade Fall MAP Score Reflection Success Criteria – I will know I am successful when I… 1. understand my Fall 2013 MAP results. 2. set attainable, measureable goals for my Winter and Spring 2014 MAP testing.
You should be using Pages 61 (Math) and 62 (Reading) in your newly updated Student Agenda.
Make sure you are looking at Math results. The 2 FA13 bars are your Math score and the MPS average. How to read your Student Progress Report…Math MAP FA13 has your latest RITband and growth since FA12. These are your RIT ranges of the four measured Math GOALS. These identify strengths and weaknesses. The higher the numbers, the better!
Using the data from your reports, add a vertical line for the district average, and theMPS ‘On-Target’ RIT of 242. Page 61 of your updated Student Agenda… 261 245-258 255-267 263-276 256-268 Shade the Fall bar from left to right to yourFA13RIT score. Our sample student has a Math RIT of 261. Complete the RIT Ranges of the 4 Math GOALS under the FALL column with your results.
Make sure you are looking at Reading results. The 2 FA13 bars are your Reading score and the MPS average. How to read your Student Progress Report…Reading MAP FA13 has your latest RITband and growth since FA12. These are your RIT ranges of the three measured Reading GOALS. These identify strengths and weaknesses. The higher the numbers, the better!
Using the data from your reports, add a vertical line for the district average, and theMPS ‘On-Target’ RIT of 233. Page 62 of your updated Student Agenda… 236 237-240 234-245 222-233 Shade the Fall bar from left to right to yourFA13RIT score. Our sample student has a Reading RIT of 236. Complete the RIT Ranges of the 3 Reading GOALS under the FALL column with your results.
MAP testing is really about working towards 3 goals as a student at Reagan… • Getting your RIT past the MPS ‘On-Target’ Score. • 12thGrade Math – 242 12thGrade Reading – 233 • 2. Showing RIT growth each time you are assessed. • 3. Maintaining or improving GOAL RIT Ranges. • The higher the numbers, the better!
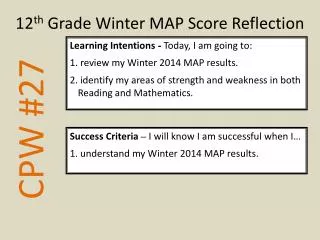
Learning Intentions - Today, I am going to: • review my Fall 2013 MAP results. • identify my areas of strength and weakness in both Reading and Mathematics. • set a goal of growth for the 2 remaining MAP tests this school year. CPW #11 12thGrade Fall MAP Score Reflection Success Criteria – I will know I am successful when I… 1. understand my Fall 2013 MAP results. 2. set attainable, measureable goals for my Winter and Spring 2014 MAP testing.