Download
1 / 19
190 likes | 205 Views
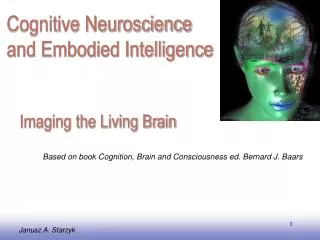
Cognitive Architectures. Imaging the Living Brain. Based on book Cognition, Brain and Consciousness ed. Bernard J. Baars. Janusz A. Starzyk. Introduction.

E N D
Cognitive Architectures Imaging the Living Brain Based on book Cognition, Brain and Consciousness ed. Bernard J. Baars Janusz A. Starzyk
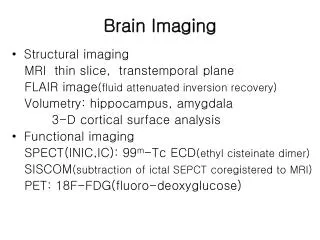
Introduction • But brain injuries are imprecise, damaged areas are hard to locate, and often observed post-mortem (as in case of Broca’s and Wernicke’s patients). • Brain also compensates for the damage, lesions change over time, adaptation occurs, so that post mortem examination is very imprecise. • Animal studies depend on presumed homologies – not very convincing. • No other animals can speak to communicate clearly what they experience. The brain imaging has been a breakthrough technology for cognitive neuroscience and cognitive psychology. Before these techniques were developed brain study was based on experiments on animals, and injured human beings.
Introduction • We can observe functional activity of the brain • Magnetic imaging technique known as diffusion tractography allows to view white (myelinated) fiber tracts from cortex to the spinal cord. The brain study was enhanced by imaging techniques like electroencephalography (EEG) based on X-rays computer tomography, positron emission tomography (PET), magnetic resonance imaging (MRI) etc.
Brain recording Individual neuron’s activities can be recorded. Picture shows spike counts for a single neuron in response to various images. This particular neuron responds selectively to images of Jennifer Aniston.
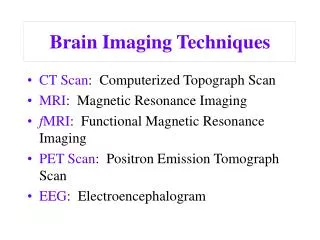
Brain imaging techniques How we learn about brain activities? • Electroencephalography, (EEG) • Magnetoencephalography, (MEG) • Arteriography or Angiography • Computerized tomography, (CAT) • Single Photon Emission Computer Tomography, (SPECT) • Positron Emission Tomography, (PET) • Magnetic Resonance Imaging, (MRI) • Functional MRI, (fMRI) • Magnetic Resonance Spectroscopy, (MRS)
Time-space tradeoff • fMRI has good spatial resolution and poor temporal resolution. • Magnetoencephalography (MEG) has a good temporal resolution but cannot locate precisely the source of firing. • Some studies combine EEG and fMRI Most popular imaging methods are compared for their time vs space resolution. They do not have yet resolution to track a single neuron or a cluster of neurons.
Single-neuron recording • Hubel and Wiesel (1962) received Nobel price for single-neuron activities recording in the cortex of a cat. • Depth electrodes used in humans only in very special cases – eg. before surgery in epileptic patients.
Single-neuron recording Conscious and unconscious observations • Single neuron recording gives us only a partial information about the brain function. • Many scientists believe that brain processes can only be observed on the population of neurons.
Animal and human studies • Until recently, studies of macaque monkeys were dominant source of information about vision, memory, attention and executive function of brain • Their brains have similar functional regions with minor anatomical differences
Electroencephalography EEG frequencies • Delta is the lowest frequency < 4 Hz and occur in a deep sleep or vegetative state of brain characterizing an unconscious person. • Theta has frequency 3.5-7.5 Hz, observed during some sleep states and during quiet focus (meditation). They are observed during memory retrieval. • Alpha waves are between 7.5 and 13 Hz. They originate from occipital lobe during relaxation with eyes closed but still awake. • Beta activity is fast irregular at low voltage 12-30 Hz. Associated with waking consciousness, busy or anxious thinking, and active concentration. • Gamma generally ranges between 26 and 70 Hz. Characterizes active exchange of information between cortical and subcortical regions.
EEG observations • High density array of EEG electrodes placed on scalp at precise locations pick up signals from dendrites of the outside layers of cortex. • Fourier analysis of EEG signal helps to classify observed responses. • EEG reveals patters during sleep, waking abnormalities, even response to music.
Magnetoencephalography (MEG) • Measures magnetic field produced by brain activities. • Is has spatial resolution of few millimeters and temporal resolution of few milliseconds. • MEG uses Magnetic Source Imaging (MSI) to superimpose magnetic activities onto brain anatomical pictures provided by MRI. • MSI is used before brain surgery to locate vital parts of the brain that must be protected during surgery.
Magnetoencephalography (MEG) Magnetic field produced by a neuron Not sensitive to top or bottom neuron activities • Due to magnetic field properties, MEG is sensitive to dendritic flow at the right angles to the walls of cortical folds (sulci).
Transcranial Magnetic Stimulation • TMS works at the milliseconds scale so it is a useful technique to study contribution of specific brain regions to cognitive process. • In this example TMS is applied to Brocka’s and Wernicke’s regions in the left hemisphere. • TMS is safe at mild levels of intensity and frequency.
fMRI • EEG and MEG measure brain activity directly. • Currently the most popular techniques fMRI (functional magnetic resonance imaging). • fMRI measures the oxygen level in local blood circulation technique called BOLD (blood-oxygen level dependent activity). • When neurons become active, local blood flow to those brain regions increases, and oxygen-rich blood occurs 2-6 sec later
fMRI principle of operation • Magnetic field aligns spins of oxygen atoms. • When the field is turned off spins return to their random orientations. • This relaxation of nuclear spin is picked up by sensitive coils and localized in 3D.
Positron emission tomography (PET) vsfMRI PET scans showing speaking, seeing, hearing and producing words • PET was developed much earlier that MRI. • Provides a measure of metabolic brain activity. • It is very expensive and requires a cyclotron. • Subject must be injected with a radioactive tracer.
Visual experiment with fMRI • fMRI images were obtained comparing face objects to nonface objects. • Subjects were supposed to match faces and their location. • Figure shows fMRI of brain activity in two different tasks. • Notice that location matching activates different brain area than face matching.
Summary • Brain imaging techniques can illustrate activities of a single neuron, large cortical structures, dynamic brain activity, and neurons connectivity. • We learned about a number of most important methods for brain imaging and discussed their properties. • Brain imaging transformed study of human cognition. • Combination of methods is used to enhance observation accuracy in time and space. • New methods are constantly being produced.