Download
1 / 24
240 likes | 414 Views
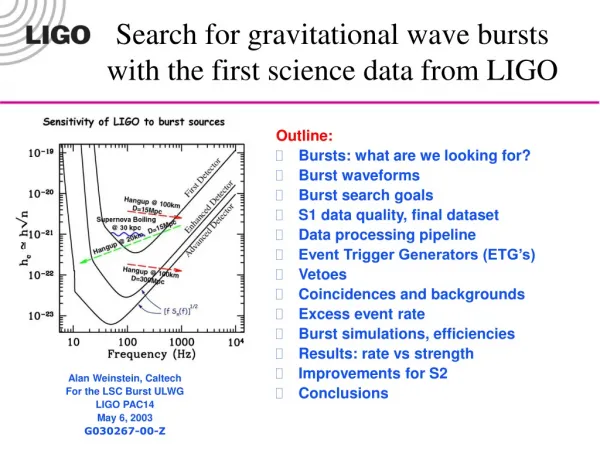
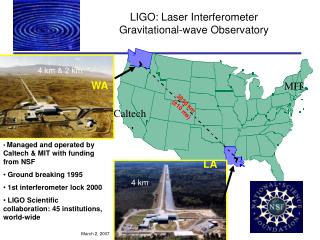
Colliding Black Holes Werner Benger, ZIB/AEI. Upper Limits from LIGO and TAMA on Gravitational-Wave Bursts. Patrick Sutton LIGO Laboratory, Caltech for the LIGO and TAMA Collaborations. Outline. Collaborative Searches LIGO-TAMA Network Analysis Overview Upper Limits & Outlook.

E N D
Colliding Black Holes Werner Benger, ZIB/AEI Upper Limits from LIGO and TAMA on Gravitational-Wave Bursts Patrick Sutton LIGO Laboratory, Caltech for the LIGO and TAMA Collaborations
Outline • Collaborative Searches • LIGO-TAMA Network • Analysis Overview • Upper Limits & Outlook Sutton GWDAW9 2004.12.17
Collaborative Searches GEO VIRGO LIGO TAMA NIOBE ALLEGRO AURIGA EXPLORER NAUTILUS • Reduction in false alarm rate due to extra coincidence (~1/century) • Increase in total usable observation time • Extract sky direction, polarization with 3+ sites. • Independent hardware, software, and algorithms minimize chances of error. • Most confident detection and maximum exploitation of gravitational waves may come from cooperative analyses by the various observatories: Sutton GWDAW9 2004.12.17
Collaborative Searches GEO VIRGO LIGO TAMA NIOBE ALLEGRO AURIGA EXPLORER NAUTILUS • Different detectors see: • … different polarization combinations. • … different parts of the sky. • … different frequency bands. • Different search algorithms, file formats, sampling frequencies, etc. • Unfortunately, these benefits don’t come without hard work. Physical and technical challenges abound. Sutton GWDAW9 2004.12.17
Collaborative Searches • Many of these benefits and costs are evident in the LIGO-TAMA joint bursts search. LIGO TAMA Sutton GWDAW9 2004.12.17
LIGO-TAMA Timeline • GWDAW 7, 2002: LIGO & TAMA sign agreement for joint analysis of data for gravitational-wave transients. • Summer 2003: Began joint bursts search using Science Run 2 / Data Taking Run 8 data (Feb – Apr 2003). • Trigger-based coincidence analysis. • Look for generic short-duration GWBs at high frequencies (~1kHz). • Complementary to TAMA-only DT8 search & LIGO-only S2 search in 100-1100Hz • Fall 2003: Inspiral & GRB 030329 analyses started (in progress). • Inspiral session: Takahashi & Fairhurst Sutton GWDAW9 2004.12.17
LIGO-TAMA Network Representative S2/DT8 Spectra Best joint sensitivity near minimum of noise envelope Focus on [700,2000]Hz Preliminary Sutton GWDAW9 2004.12.17
LIGO-TAMA Network Representative S2/DT8 Spectra Best joint sensitivity near minimum of noise envelope Focus on [700,2000]Hz Near 700Hz: expect sensitivity limited by TAMA Near 2000Hz: expect similar sensitivities Preliminary Sutton GWDAW9 2004.12.17
S2/DT8 Duty Cycles (after data-quality cuts) nT1 T1 not operating nL1 L1 not operating • Data sets analyzed (3+ IFOs): • LIGO-TAMA has double the total usable data set of LIGO alone • Better chance of “getting lucky” in a search • Cut rate upper limits in half Sutton GWDAW9 2004.12.17
Analysis Procedure wave- form • Straightforward coincidence analysis. • No bulk sharing of data; only triggers exchanged. Sutton GWDAW9 2004.12.17
Trigger Generation • LIGO: TFClusters+BurstDSO algorithm: • Prefiltering with high-pass, linear-predictor error filters. • Construct time-frequency spectrogram, trigger on clusters of pixels which are “loud” compared to average noise level. • Peak time, duration, frequency, bandwidth, SNR; keep only triggers overlapping [700,2000]Hz. • Sylvestre, PRD 66 102004 (2002). • TAMA: Excess-Power algorithm: • Prefiltering for line removal. • Construct spectrogram, normalize by background, sum over fixed set of frequency bins in [230, 2500]Hz at each time step. Trigger if SNR>4. • Combine contiguous segments above threshold into single trigger with peak time time, duration, SNR. • Vetoes: • glitches in light intensity in power recycling cavity • time-scale veto to distinguish short-duration GWBs from detector nonstationarity • Ando et al., gr-qc/0411027, Anderson, et al., PRD 63 042003 (2001) Sutton GWDAW9 2004.12.17
Coincidence & False Rate • Require candidate GWBs to be seen in all detectors simultaneously. • Timing accuracy of ~1ms for short signals (from simulations). • Use coincidence window = light travel time + ~10ms safety margin. • R-Statistic: LIGO coincidences tested for waveform consistency. • Cross-correlation test (Cadonati, CQG 21 S1695 (2004)). • Strong reduction of false alarm rate (>90%) with no loss of efficiency • Estimate false alarm rate using unphysical time shifts. • LIGO 2-site network = 47 lags in (-115s,+115s) • LIGO-TAMA 3-site network = 472 = 2209 lags in (-115s,+115s). Sutton GWDAW9 2004.12.17
Simulations 0.02 • Inject simulated GWBs to tune analysis and estimate network sensitivity. • Procedure: Simulated h(t) signals written to frame files, added to raw data streams. Include effects of antenna response, sky position, and polarization. • Signals: Use Gaussian-modulated sinusoids for this first analysis. • Q = 8.9, f0 = {700, 849, 1053, 1304, 1615, 2000}Hz • Isotropic sky distribution, random linear polarization Sutton GWDAW9 2004.12.17
Tuning • Tune for best efficiency at each false rate: • Select TFClusters, Power thresholds to match efficiencies across detectors • Similar in spirit to IGEC procedure (Astone et al., PRD 68 022001 (2003)) • Select r-statistic threshold to ensure false rate for << 1 event over livetime (efficiencies not affected). • Blind analysis. • Set all thresholds, etc. by looking only at time-shifted data (no GWBs) or with 10% subset of data (“playground”) which is not used for upper limits Sutton GWDAW9 2004.12.17
Efficiency vs False Rate Preliminary Y-axis: sine-Gaussian amplitude at which detection probability is 0.5 (with frequency, sky & polarization averaging) Chosen single-IFO operating points Sutton GWDAW9 2004.12.17
Efficiency vs False Rate H1-H2-L1-T1 H1-H2-T1 H1-H2-L1 Preliminary LIGO-TAMA network performance. Plotted false rates are upper limits (no surviving coincidences from time lags). O(1/century) false rates achievable. 10-10 10-5 100 Sutton GWDAW9 2004.12.17
Network Efficiency From sine-Gaussian simulations (with sky & polarization averaging) Different network combinations have similar efficiency (factor ~2 in 50% point). Preliminary Sutton GWDAW9 2004.12.17
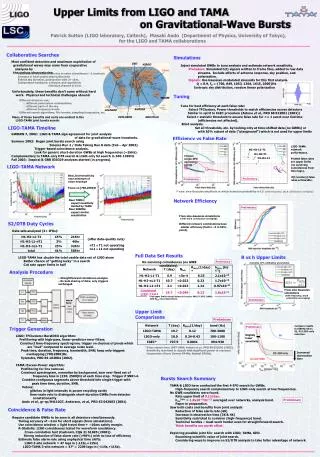
Full Data Set Results Preliminary • No surviving coincidences (no GWB candidates). *Set upper limits using Feldman & Cousins, PRD 57 3873 (1998), with Nbck=0 (conservative). Sutton GWDAW9 2004.12.17
R vs h Upper Limits (includes 11% calibration uncertainty) From sine-Gaussian simulations (with frequency, sky & polarization averaging) Preliminary Sutton GWDAW9 2004.12.17
Upper Limit Comparisons Preliminary *5-bar search from 1997-2000, Astone et al., PRD 68 022001 (2003). Sensitivity restricted to signals with significant power at resonant frequencies of bars (lowest 694Hz, highest 930Hz). Sutton GWDAW9 2004.12.17
Upper Limit Comparisons Preliminary Compare results for 849Hz SG to S1, S2 LIGO-only searches. Slightly lower sensitivity Increased observation time Sutton GWDAW9 2004.12.17
Bursts Search Summary • TAMA & LIGO have conducted the first 4-IFO search for GWBs. • High-frequency search complementary to LIGO-only search at low frequencies. • No GWB candidates were found. • Rate upper limit of 0.12/day. • hrss50% = 1.8x10⁻¹⁹Hz-1/2 averaged over networks, analysis band. • Paper in preparation. • Saw both costs and benefits from joint analysis • Reduction of false alarm rate (4X) • Increase in observation time (3X & 4X) • Sensitivity restricted to common (high-frequency) band. • Technical hurdles – must work harder even for straightforward search. • Think benefits are worth effort. • Exploring possible joint S3+ search with LIGO, TAMA, GEO. • Examining scientific value of joint search. • Considering ways to improve on S2/DT8 analysis to take fuller advantage of network. Preliminary Sutton GWDAW9 2004.12.17
Network Efficiency, by f0 Preliminary Efficiency of 4X detection, by central frequency of signal Sensitivity ~constant across band. Sutton GWDAW9 2004.12.17
Network Efficiency, by f0 Preliminary Efficiency of LIGO 3X detection, by central frequency of signal Improvement at lower frequencies – TAMA limits sensitivity there. Sutton GWDAW9 2004.12.17