Download
1 / 14
140 likes | 273 Views
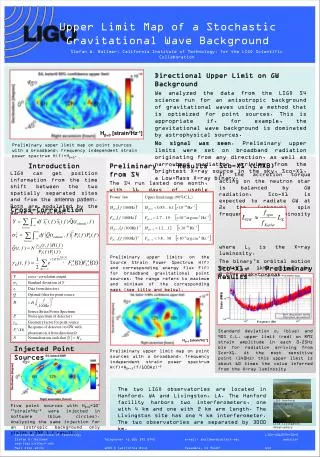
Upper Limits on the Stochastic Background of Gravitational Waves from LIGO. Vuk Mandic Einstein2005 Conference Paris, July 20 2005. Outline. Sources and Observations Searching for Gravitational Waves with Interferometers Searching for Stochastic Background Results Outlook and Conclusions.

E N D
Upper Limits on the Stochastic Background of Gravitational Waves from LIGO Vuk Mandic Einstein2005 Conference Paris, July 20 2005
Outline • Sources and Observations • Searching for Gravitational Waves with Interferometers • Searching for Stochastic Background • Results • Outlook and Conclusions
Stochastic Background of Gravitational Waves • Energy density: • Characterized by log-frequency spectrum: • Related to the strain spectrum: • Strain scale:
Advanced LIGO, 1 yr data ExpectedSensitivity ~ 7x10⁻¹⁰ LIGO S1, 2 wk data Ω0h1002 < 23 PRD 69(2004)122004 Initial LIGO, 1 yr data ExpectedSensitivity ~ 2x10⁻⁶ Laser Interferometer Space Antenna - LISA Nucleosynthesis Pulsar Horizon size GW redshifted into LIGO band were produced at T ~ 109 GeV CMB Landscape 0 -2 -4 (W0h1002) Cosmic strings -6 -8 Log Pre-big bang model -10 EW or SUSY Phase transition Inflation -12 Cyclic model Slow-roll -14 -16 -14 -12 -10 -8 -6 -4 -2 0 2 4 6 8 -18 10 Log (f [Hz]) f ~ 1/Plank scale – red shifted from the Plank era to the present time f ~ H0 - one oscillation in the lifetime of the universe
Interferometers as Gravitational Wave Detectors • Gravitational wave stretches one arm while compressing the other. • Interferometer measures the arm-length difference. • All masses are free. • Fabry-Perot cavities effectively magnify the arm lengths. • Input field is phase modulated: • Ein = E0 x ei**cos(t) • Output voltage is demodulated • Pound-Drever-Hall lock-in. Time
Hanford, WA MIT 3002 km (L/c = 10 ms) Caltech Livingston, LA LIGO Observatories • 3 interferometers: • H1: 4 km at Hanford, WA • H2: 2 km at Hanford, WA • L1: 4 km at Livingston, WA • Correlating interferometers significantly improves the sensitivity. • Assuming instrumental correlations are negligible.
LIGO Sensitivity • Fundamental sensitivity limitations: • Seismic noise: <30 Hz • Thermal noise: 30-150 Hz • Shot noise: >150 Hz • In practice, many other sources: • Intensity and frequency noise of the laser • Auxiliary feedback loops • Rapidly approaching design sensitivity
Detection Strategy • Cross-correlation estimator • Theoretical variance • Optimal Filter Overlap Reduction Function
PI 60s t Analysis Details • 60-sec segments • Sliding Point Estimate • Avoid bias • Allows stationarity cut • Data manipulation: • Down-sample to 1024 Hz • Notch: 16 Hz, 60 Hz, simulated pulsar lines • High-pass filter • 50% overlapping Hann windows
Stationarity Cut For each segment, require:
Hardware and Software Injections • Hardware Injections: • Performed by physically moving the test-masses • Successfully recovered • Ultimate test of the analysis code • Software injections • Performed by adding a stochastic time-series in the analysis code • By repeating many times can check the theoretical variance
S3 Results • S3 Run: 31 Oct 2003 – 9 Jan 2004 • H1-L1 Pair, Exposure of 218 hours h100=0.72
S3 Results Running Point Estimate Cross-Correlation Spectrum (α=0) CC spectrum (arb) Ωgw 103 Ωgw 103 Cumulative Analysis Time (hr) Frequency (Hz)
Outlook and Conclusions • Run S4 • 1 month (Feb-Mar 2005) • Expect ~10 times better sensitivity for the H1-L1 pair • Year long run expected to start in the fall • Design sensitivity • Another factor of ~10 expected • H1-H2 pair even more sensitive • But also more susceptible to site-related correlations • AdvLIGO: ~1000x improvement in sensitivity