Download
1 / 36
360 likes | 499 Views
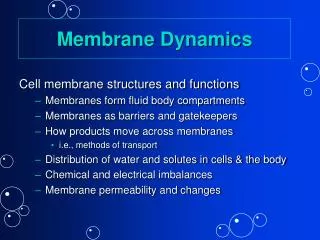
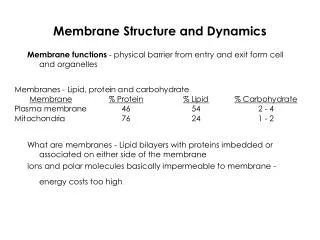
Membrane Dynamics. 5. The Body Is Mostly Water. Distribution of water volume in the three body fluid compartments. Figure 5-28. Osmosis and Osmotic Pressure. Osmolarity describes the number of particles in solution. Figure 5-29. Osmosis and Osmotic Pressure. Figure 5-29 (1 of 3).

E N D
The Body Is Mostly Water Distribution of water volume in the three body fluid compartments Figure 5-28
Osmosis and Osmotic Pressure Osmolarity describes the number of particles in solution Figure 5-29
Osmosis and Osmotic Pressure Figure 5-29 (1 of 3)
Osmosis and Osmotic Pressure Figure 5-29 (2 of 3)
Osmosis and Osmotic Pressure Figure 5-29 (3 of 3)
Osmolarity: Comparing Solutions • Solution A = 1 OsM Glucose • Solution B = 2 OsM Glucose • B is hyperosmotic to A • A is hyposmotic to B • What would be the osmolarity of a solution which is isosmotic to A? to B?
Tonicity Tonicity describes the volume change of a cell placed in a solution
Tonicity Tonicity depends on the relative concentrations of nonpenetrating solutes Figure 5-30a
Tonicity Tonicity depends on nonpenetrating solutes only Figure 5-30b
Electricity Review • Law of conservation of electrical charges • Opposite charges attract; like charges repel each other • Separating positive charges from negative charges requires energy • Conductor versus insulator
Separation of Electrical Charges Resting membrane potential is the electrical gradient between ECF and ICF Figure 5-32b
Separation of Electrical Charges Resting membrane potential is the electrical gradient between ECF and ICF Figure 5-32c
Potassium Equilibrium Potential Figure 5-34a
Potassium Equilibrium Potential Figure 5-34b
Potassium Equilibrium Potential Resting membrane potential is due mostly to potassium Figure 5-34c
Sodium Equilibrium Potential Can be calculated using the Nernst Equation Figure 5-35
Changes in Membrane Potential Terminology associated with changes in membrane potential PLAY Animation: Nervous I: The Membrane Potential Figure 5-37
Insulin Secretion and Membrane Transport Processes (a) Beta cell at rest. The KATP channel is open and the cell is at its resting membrane potential. 1 2 3 4 5 KATP channels open. Metabolism slows. ATP decreases. Low glucose levels in blood Cell at resting membrane potential; no insulin is released. K+ leaks out of cell K+ Voltage-gated Ca2+ channel closed Glucose ATP Metabolism GLUT transporter No insulin secretion Insulin in secretory vesicles Figure 5-38a
Insulin Secretion and Membrane Transport Processes (a) Beta cell at rest. The KATP channel is open and the cell is at its resting membrane potential. 1 Low glucose levels in blood Glucose Figure 5-38a, step 1
Insulin Secretion and Membrane Transport Processes (a) Beta cell at rest. The KATP channel is open and the cell is at its resting membrane potential. 1 2 Metabolism slows. Low glucose levels in blood Glucose Metabolism GLUT transporter Figure 5-38a, steps 1–2
Insulin Secretion and Membrane Transport Processes (a) Beta cell at rest. The KATP channel is open and the cell is at its resting membrane potential. 1 2 3 Metabolism slows. ATP decreases. Low glucose levels in blood Glucose ATP Metabolism GLUT transporter Figure 5-38a, steps 1–3
Insulin Secretion and Membrane Transport Processes (a) Beta cell at rest. The KATP channel is open and the cell is at its resting membrane potential. 1 2 3 4 KATP channels open. Metabolism slows. ATP decreases. Low glucose levels in blood K+ leaks out of cell K+ Glucose ATP Metabolism GLUT transporter Figure 5-38a, steps 1–4
Insulin Secretion and Membrane Transport Processes (a) Beta cell at rest. The KATP channel is open and the cell is at its resting membrane potential. 1 2 3 4 5 KATP channels open. Metabolism slows. ATP decreases. Low glucose levels in blood Cell at resting membrane potential; no insulin is released. K+ leaks out of cell K+ Voltage-gated Ca2+ channel closed Glucose ATP Metabolism GLUT transporter No insulin secretion Insulin in secretory vesicles Figure 5-38a, steps 1–5
Insulin Secretion and Membrane Transport Processes (b) Beta cell secreting insulin. Closure of the KATP channel depolarizes the cell, triggering exocytosis of insulin. 1 2 3 4 5 KATP channels close. Metabolism increases. ATP increases. High glucose levels in blood Cell depolarizes and calcium channels open. 6 Ca2+ entry acts as an intracellular signal. Ca2+ Glucose Glycolysis and citric acid cycle ATP Ca2+ 7 GLUT transporter Ca2+ signal triggers exocytosis, and insulin is secreted. Figure 5-38b
Insulin Secretion and Membrane Transport Processes (b) Beta cell secreting insulin. Closure of the KATP channel depolarizes the cell, triggering exocytosis of insulin. 1 High glucose levels in blood Glucose Figure 5-38b, step 1
Insulin Secretion and Membrane Transport Processes (b) Beta cell secreting insulin. Closure of the KATP channel depolarizes the cell, triggering exocytosis of insulin. 1 2 Metabolism increases. High glucose levels in blood Glucose Glycolysis and citric acid cycle GLUT transporter Figure 5-38b, steps 1–2
Insulin Secretion and Membrane Transport Processes (b) Beta cell secreting insulin. Closure of the KATP channel depolarizes the cell, triggering exocytosis of insulin. 1 2 3 Metabolism increases. ATP increases. High glucose levels in blood Glucose Glycolysis and citric acid cycle ATP GLUT transporter Figure 5-38b, steps 1–3
Insulin Secretion and Membrane Transport Processes (b) Beta cell secreting insulin. Closure of the KATP channel depolarizes the cell, triggering exocytosis of insulin. 1 2 3 4 KATP channels close. Metabolism increases. ATP increases. High glucose levels in blood Glucose Glycolysis and citric acid cycle ATP GLUT transporter Figure 5-38b, steps 1–4
Insulin Secretion and Membrane Transport Processes (b) Beta cell secreting insulin. Closure of the KATP channel depolarizes the cell, triggering exocytosis of insulin. 1 2 3 4 5 KATP channels close. Metabolism increases. ATP increases. High glucose levels in blood Cell depolarizes and calcium channels open. Glucose Glycolysis and citric acid cycle ATP GLUT transporter Figure 5-38b, steps 1–5
Insulin Secretion and Membrane Transport Processes (b) Beta cell secreting insulin. Closure of the KATP channel depolarizes the cell, triggering exocytosis of insulin. 1 2 3 4 5 KATP channels close. Metabolism increases. ATP increases. High glucose levels in blood Cell depolarizes and calcium channels open. 6 Ca2+ entry acts as an intracellular signal. Ca2+ Glucose Glycolysis and citric acid cycle ATP Ca2+ GLUT transporter Figure 5-38b, steps 1–6
Insulin Secretion and Membrane Transport Processes (b) Beta cell secreting insulin. Closure of the KATP channel depolarizes the cell, triggering exocytosis of insulin. 1 2 3 4 5 KATP channels close. Metabolism increases. ATP increases. High glucose levels in blood Cell depolarizes and calcium channels open. 6 Ca2+ entry acts as an intracellular signal. Ca2+ Glucose Glycolysis and citric acid cycle ATP Ca2+ 7 GLUT transporter Ca2+ signal triggers exocytosis, and insulin is secreted. Figure 5-38b, steps 1–7
Summary • Mass balance and homeostasis • Law of mass balance • Excretion • Metabolism • Clearance • Chemical disequilibrium • Electrical disequilibrium • Osmotic equilibrium
Summary • Diffusion • Protein-mediated transport • Roles of membrane proteins • Channel proteins • Carrier proteins • Active transport
Summary • Vesicular transport • Phagocytosis • Endocytosis • Exocytosis • Transepithelial transport
Summary • Osmosis and tonicity • Osmolarity • Nonpenetrating solutes • Tonicity • The resting membrane potential • Insulin secretion