Download
1 / 51
560 likes | 623 Views
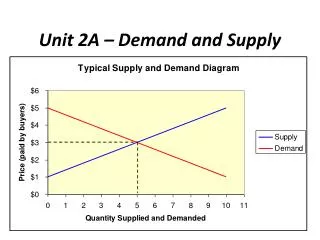
Supply and Demand: How Markets Work. In this chapter you will…. Learn the nature of a competitive market. Examine what determines the demand for a good in a competitive market. Examine what determines the supply of a good in a competitive market.

E N D
Supply and Demand: How Markets Work
In this chapter you will… • Learn the nature of a competitive market. • Examine what determines the demand for a good in a competitive market. • Examine what determines the supply of a good in a competitive market. • See how supply and demand together set the price of a good and the quantity sold. • Consider the key role of prices in allocating scarce resources.
THE MARKET FORCES OF SUPPLY AND DEMAND • Supplyand Demandare the two words that economists use most often. • Supply and Demandare the forces that make market economies work! • Modern microeconomicsis about supply, demand, and market equilibrium.
MARKETS AND COMPETITION • The terms supplyand demandrefer to the behaviour of people. • .as they interact with one another in markets. • A marketis a group of buyers and sellers of a particular good or service. • Buyers determine demand... • Sellers determine supply…
Competitive Markets • A Competitive Marketis a market with many buyers and sellers so that each has a negligible impact on the market price.
Competition: Perfect or Otherwise • Perfectly Competitive: • Homogeneous Products • Buyers and Sellers are Price Takers • Monopoly: • One Seller, controls price • Oligopoly: • FewSellers, not aggressive competition • Monopolistic Competition: • Many Sellers, differentiated products
DEMAND • Quantity Demanded refers to the amount (quantity) of a good that buyers are willing to purchase at alternative prices for a given period.
Determinants of Demand • What factors determine how much ice cream you will buy? • What factors determine how much you will really purchase? • Product’s Own Price • Consumer Income • Prices of Related Goods • Tastes • Expectations • Number of Consumers
1) Price Law of Demand • The law of demand states that, other things equal, the quantity demanded of a good falls when the price of the good rises.
2) Income • As income increases the demand for a normal goodwill increase. • As income increases the demand for an inferior good will decrease.
3) Prices of Related Goods Prices of Related Goods • When a fall in the price of one good reduces the demand for another good, the two goods are called substitutes. • When a fall in the price of one good increases the demand for another good, the two goods are called complements.
4) Others • Tastes • Expectations
The Demand Schedule and the Demand Curve • The demand schedule is a table that shows the relationship between the price of the good and the quantity demanded. • The demandcurve is a graph of the relationship between the price of a good and the quantity demanded. • Ceteris Paribus: “Other thing being equal”
1.50 6 2.00 4 2.50 2 3.00 0 Table 4-1: Catherine’s Demand Schedule Price of Ice-cream Cone ($) Quantity of cones Demanded 0.00 12 0.50 10 1.00 8
$3.00 2.50 2.00 1.50 1.00 0.50 12 0 2 4 6 8 10 Figure 4-1: Catherine’s Demand Curve Price of Ice-Cream Cone Quantity of Ice-Cream Cones
Market Demand Schedule • Market demand is the sum of all individual demands at each possible price. • Graphically, individual demand curves are summed horizontally to obtain the market demand curve. • Assume the ice cream market has two buyers as follows…
1.00 8 5 13 1.50 6 4 10 2.00 4 3 7 2.50 2 2 4 Table 4-2: Market demand as the Sum of Individual Demands Price of Ice-cream Cone ($) Catherine Nicholas Market 0.00 12 7 19 + = 0.50 10 6 16 3.00 0 1 1
Increase in demand Decrease in demand D2 D1 D3 Figure 4-3: Shifts in the Demand Curve Price of Ice-Cream Cone Quantity of Ice-Cream Cones
Shifts in the Demand Curve versus Movements Along the Demand Curve
B A $2.00 D1 D2 10 Figure 4-4 a): A Shifts in the Demand Curve Price of Cigarettes, per Pack. A policy to discourage smoking shifts the demand curve to the left. 20 0 Number of Cigarettes Smoked per Day
C A tax that raises the price of cigarettes results in a movements along the demand curve. $4.00 A D1 12 Figure 4-4 b): A Movement Along the Demand Curve Price of Cigarettes, per Pack. $2.00 20 0 Number of Cigarettes Smoked per Day
SUPPLY • Quantity Supplied refers to the amount(quantity) of a good that sellers arewilling to make available for sale at alternative prices for a given period.
Determinants of Supply • What factors determine how much ice cream you are willing to offer or produce? • Product’s Own Price • Input prices • Technology • Expectations • Number of sellers
1) Price Law of Supply • The law of supply states that, other things equal, the quantity supplied of a good rises when the price of the good rises.
The Supply Schedule and the Supply Curve • The supply schedule is a table that shows the relationship between the price of the good and the quantity supplied. • The supplycurve is a graph of the relationship between the price of a good and the quantity supplied. • Ceteris Paribus: “Other thing being equal”
1.50 2 2.00 3 2.50 4 3.00 5 Table 4-4: Ben’s Supply Schedule Price of Ice-cream Cone ($) Quantity of cones Supplied 0.00 0 0.50 0 1.00 1
$3.00 2.50 2.00 1.50 1.00 0.50 1 2 3 4 5 Figure 4-5: Ben’s Supply Curve Price of Ice-Cream Cone 6 8 10 12 0 Quantity of Ice-Cream Cones
Market Supply Schedule • Market supply is the sum of all individual supplies at each possible price. • Graphically, individual supply curves are summed horizontally to obtain the market demand curve. • Assume the ice cream market has two suppliers as follows…
1.00 1 0 1 1.50 2 2 4 2.00 3 4 7 2.50 4 6 10 Table 4-5: Market supply as the Sum of Individual Supplies Price of Ice-cream Cone ($) Ben Nicholas Market 0.00 0 0 0 + = 0.50 0 0 0 3.00 5 8 13
S3 S1 S2 Decrease in supply Increase in supply Figure 4-7: Shifts in the Supply Curve Price of Ice-Cream Cone Quantity of Ice-Cream Cones
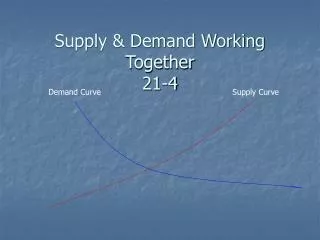
SUPPLY AND DEMAND TOGETHER • Equilibriumrefers to a situation in which the price has reached the level where quantity supplied equals quantity demanded.
Equilibrium • Equilibrium Price • The price that balances quantity supplied and quantity demanded. • On a graph, it is the price at which the supply and demand curves intersect. • Equilibrium Quantity • The quantity supplied and the quantity demanded at the equilibrium price. • On a graph it is the quantity at which the supply and demand curves intersect.
Equilibrium Demand Schedule Supply Schedule At $2.00, the quantity demanded is equal to the quantity supplied!
Supply $2.00 Equilibrium Equilibrium price Demand Equilibrium quantity Figure 4-8: The Equilibrium of Supply and Demand Price of Ice-Cream Cone 0 1 2 3 4 5 6 7 8 9 10 11 Quantity of Ice-Cream Cones
Equilibrium • Surplus • When price > equilibrium price, then quantity supplied > quantity demanded. • There is excess supply or a surplus. • Suppliers will lower the price to increase sales, thereby moving toward equilibrium. • Shortage • When price < equilibrium price, then quantity demanded > the quantity supplied. • There is excess demand or a shortage. • Suppliers will raise the price due to too many buyers chasing too few goods, thereby moving toward equilibrium.
Surplus Supply $2.50 $2.00 Demand Quantity Demanded Quantity Supplied Figure 4-9 a): Excess Supply Price of Ice-Cream Cone 0 1 2 3 4 5 6 7 8 9 10 11 Quantity of Ice-Cream Cones
Supply Shortage $1.50 $2.00 Demand Quantity Supplied Quantity Demanded Figure 4-9 b): Excess Demand Price of Ice-Cream Cone 0 1 2 3 4 5 6 7 8 9 10 11 Quantity of Ice-Cream Cone
Three Steps To Analyzing Changes in Equilibrium • Decide whether the event shifts the supply or demand curve (or both). • Decide whether the curve(s) shift(s) to the left or to the right. • Use the supply-and-demand diagram to see how the shift affects equilibrium price and quantity. • Example:A Heat Wave
1. Hot weather increases the demand for ice cream… Supply $2.50 $2.00 D2 Initial equilibrium 2. … resulting in a higher price … 3. … and a higher quantity sold. Figure 4-10: How an Increase Demand Affects the Equilibrium Price of Ice-Cream Cone New equilibrium D1 0 1 2 3 4 5 6 7 10 11 Quantity of Ice-Cream Cone
S2 1. An earthquake reduces the supply of ice cream… S1 $2.50 $2.00 2. … resulting in a higher price … 3. … and a lower quantity sold. Figure 4-11: How a Decrease Demand Affects the Equilibrium Price of Ice-Cream Cone New equilibrium Initial equilibrium Demand 0 1 2 3 4 7 10 11 Quantity of Ice-Cream Cones
Large increase in demand S2 New equilibrium P2 Small decrease in supply Initial equilibrium D2 D1 Q2 Figure 4-12 a): A Shift in Both Supply and Demand Price of Ice-Cream Cone S1 P1 0 Q1 Quantity of Ice-Cream Cone
Small increase in demand S2 New equilibrium P2 Large decrease in supply Initial equilibrium D2 D1 Q2 Figure 4-12 b): A Shift in Both Supply and Demand Price of Ice-Cream Cone S1 P1 0 Q1 Quantity of Ice-Cream Cone
Table 4-8: What Happens to Price and Quantity when Supply or Demand Shifts
Concluding Remarks… • Market economies harness the forces of supply and demand. . . • Supply and Demand together determine the prices of the economy’s different goods and services. . . • Prices in turn are the signals that guide the allocation of resources.
Summary • Economists use the model of supply and demand to analyze competitive markets. • In a competitive market, there are many buyers and sellers, each of whom has little or no influence on the market price.
Summary • The demand curve shows how the quantity of a good depends upon the price. • According to the law of demand, as the price of a good falls, the quantity demanded rises. Therefore, the demand curve slopes downward. • In addition to price, other determinants of how much consumers want to buy include income, the prices of complements and substitutes, tastes, expectations, and the number of buyers. • If one of these factors changes, the demand curve shifts.
Summary • The supply curve shows how the quantity of a good supplied depends upon the price. • According to the law of supply, as the price of a good rises, the quantity supplied rises. Therefore, the supply curve slopes upward. • In addition to price, other determinants of how much producers want to sell include input prices, technology, expectations, and the number of sellers. • If one of these factors changes, the supply curve shifts.
Summary • Market equilibrium is determined by the intersection of the supply and demand curves. • At the equilibrium price, the quantity demanded equals the quantity supplied. • The behavior of buyers and sellers naturally drives markets toward their equilibrium.